Kickstarter Bag Logistics Case Study: 1,200 Backers in 30 Countries
This case study follows a bag campaign that closed at 1,204 pledges and delivered 1,187 rewards across 30 countries. Production took 6 weeks of a 39 week window; the rest was survey, sampling, inspection, freight and dispatch waves. Three freight lanes replaced one global service and cut freight 31 percent. Selective DDP tied up 9,400 USD and removed about 25 refusals. A fold change found during sampling cut billed volumetric weight from 6.7 kg to 4.1 kg and saved roughly 11,000 USD. Realised landed cost ran 14.30 to 34.10 USD per parcel by zone.
- The brief: 1,200 backers across 30 countries
- Backer distribution and what it did to the plan
- Tier structure and the SKU count that followed
- Production planning: one shell, three colourways
- Sampling decisions that changed the packing method
- Freight architecture: two hubs and one direct lane
- Duty strategy: where DDP paid for itself
- The nine month timeline, week by week
- What went wrong, and what it cost
- Final cost per backer, by zone
- Five decisions that produced this outcome
- What we would do differently at 2,400 backers
The brief: 1,200 backers across 30 countries
This is a reconstruction of a campaign our team supported, with the product details changed and the numbers rounded. It is included because the shape of the problem is far more common than any single campaign: a mid-sized bag campaign that funded comfortably, ended up with backers spread across 30 countries, and had no fulfilment plan beyond a freight quote and a spreadsheet of addresses.
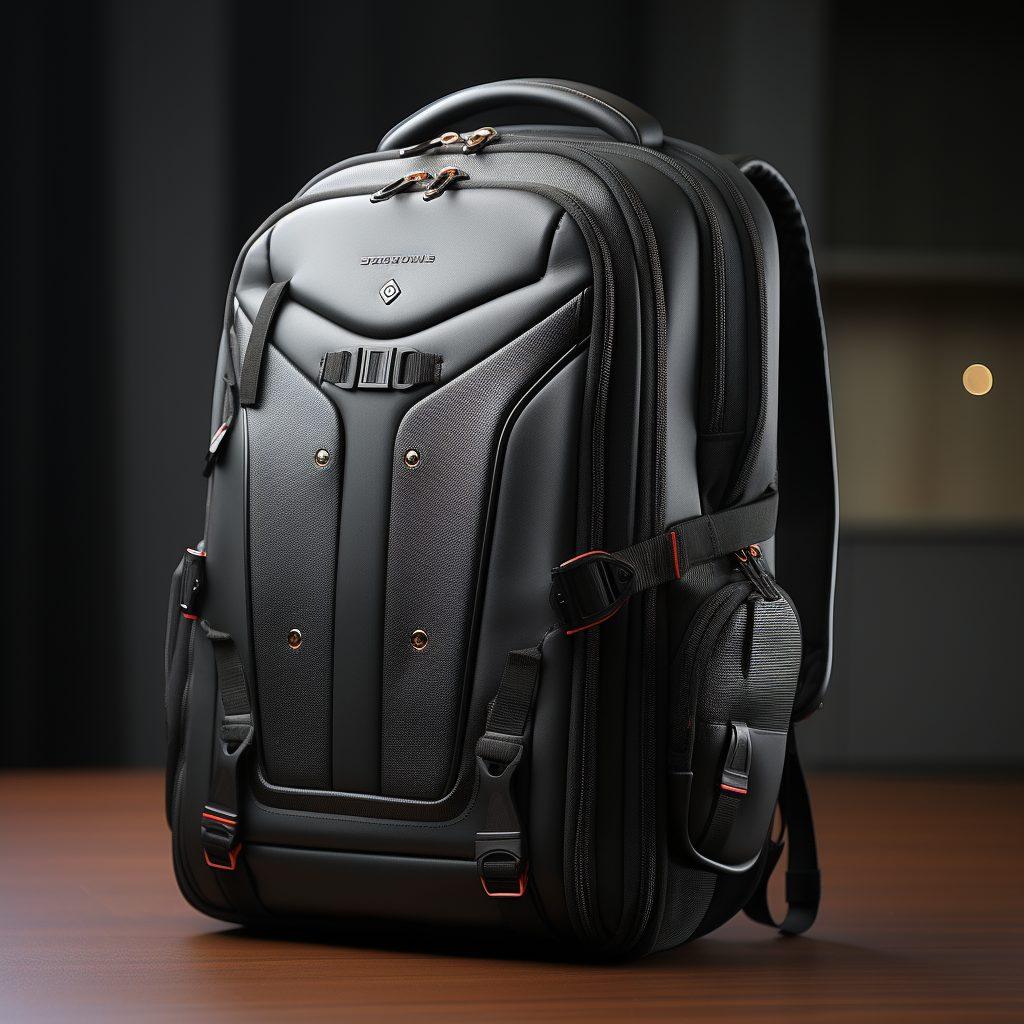
The campaign closed at 1,204 pledges. After payment failures and two cancellations, 1,187 rewards had to be delivered. Four reward tiers were offered. The product was an 18 litre daypack with one optional organiser insert and one optional padded strap. Nothing about the product was unusual, which is the point: the difficulty in this campaign came entirely from distribution and configuration, not from the bag.
The creator's original plan was to ship everything from origin by courier, offer free worldwide shipping, and order exactly 1,204 units. All three of those decisions turned out to be wrong, and the case study below is mostly the story of replacing them. We have supported more than 20 campaigns, and the pattern in this one repeats with remarkable consistency.
Two constraints framed everything. Production runs on 500 pcs per style and per colourway, so the colourway decision had volume consequences. And the campaign had promised a delivery month, not a date, which gave a nine month window from close to last parcel and turned out to be the single most valuable decision on the page.
It is also worth stating what the creator got right before launch, because it is easy to read a case study as a list of corrections. The reward ladder was simple, the product used one shell rather than three, the survey was written before the campaign went live, and the delivery promise was a month rather than a date. Those four choices, made in the two weeks before launch, are what made the later corrections cheap.
Backer distribution and what it did to the plan
The first useful exercise was plotting the backer list on a map. Roughly 34 percent sat in the United States, 27 percent in the European Union, 8 percent in the United Kingdom, 6 percent in Canada, 5 percent in Australia and New Zealand, 4 percent in Japan, and the remaining 16 percent spread across 24 countries with no more than 40 backers in any one.
That distribution kills the case for a single shipping strategy. A plan optimised for the United States, where parcels are cheap and backers expect to pay duty, is a bad plan for the European Union, where landed cost is high and refusal risk is real. A plan optimised for the tail, where 24 countries hold 190 backers between them, is a bad plan for the head.
The practical consequence was a three lane architecture: direct consolidation into the United States, a second consolidation into a European hub covering the EU and the United Kingdom, and postal service for the long tail. Three lanes sounds more complex than one, and it is, but it removed roughly 31 percent of the original all-courier freight estimate.
| Destination group | Backers | Share | Lane |
|---|---|---|---|
| United States | 404 | 34 percent | Air consolidation, US injection |
| European Union | 320 | 27 percent | Sea consolidation, EU hub, DDP |
| United Kingdom | 95 | 8 percent | EU hub, DDP |
| Canada | 71 | 6 percent | Direct courier, DDU |
| Australia and New Zealand | 59 | 5 percent | Direct courier, DDU |
| Japan | 47 | 4 percent | Direct courier, DDU |
| 24 other countries | 191 | 16 percent | Postal parcel, DDU |
Tier structure and the SKU count that followed
Four tiers with two optional add-ons each generates a theoretical maximum of 4 tiers times 3 colourways times 4 add-on combinations, which is 48 configurations. The actual take was narrower. Tier 1 took no add-ons by design, tier 4 included both, and only tiers 2 and 3 offered a genuine choice. The realised configuration count was 13, which is comfortably manageable.
The work that produced that number was not clever design. It was an early constraint agreed before the campaign page was written: colourways capped at three, add-ons linked to tier rather than freely combinable, and no add-on with its own colourway. Those three rules are what turned 48 theoretical configurations into 13 real ones.
There is a detail worth highlighting because it recurs. Roughly 9 percent of backers chose no colourway at all when the survey was sent. Left unmanaged, that becomes 107 parcels held hostage. The fix was a default rule written into the survey: non-responders receive the primary colourway after two reminders, and the default was stated on the campaign page. Only 31 backers ended up on the default.
The add-on take rates were the other number worth recording, because they diverged from forecast in both directions. The organiser insert came in at 34 percent against a forecast of 40, and the padded strap at 41 percent against a forecast of 28. Neither error was large in absolute units, but the strap error was large enough to matter, and it is the reason the strap buffer was consumed inside the first three weeks.
Production planning: one shell, three colourways
The colourway decision is where the campaign met the minimum order quantity. Backer preference split roughly 52 percent slate, 31 percent sand and 17 percent forest. Applied to 1,187 units that is 617, 368 and 202. Two of those three are below the 500 pcs per style and per colourway threshold, so the honest options were to drop a colourway or to round up.
The campaign rounded up to 500 in each of the three, for a total order of 1,500 units. That is 313 more bags than there were backers, which sounds reckless until you separate the three uses those extra units served. About 104 became the replacement and warranty pool, roughly 3 percent of the run held loose. The remaining 209 went to post-campaign retail.
The retail decision is what made the rounding defensible. Selling 209 bags at a retail price of 78 USD against a marginal production cost of roughly 21 USD recovered more than the cost of the extra 313 units. A campaign without a retail plan should think much harder before rounding up, because the rewards fulfilment plan is where surplus stock either becomes working capital or dead inventory., because the leftover inventory becomes dead stock instead of working capital.
One production detail mattered more than expected. The three colourways shared one body fabric and differed in trim: zip tape, binding, webbing and pull cords. That choice kept the order to a single fabric lot with three trim packages, and it is the reason three colourways were affordable at 1,500 units instead of requiring three separate fabric commitments.
The trim-led approach had one consequence worth naming honestly. Two backers out of 1,187 noticed that the shell fabric was identical across colourways and said so publicly. Both were answered with a straightforward explanation of the trim difference and both accepted it. A campaign selling at a higher price point, or one whose marketing implies structural differences, should expect that conversation to be less forgiving.
Sampling decisions that changed the packing method
Sampling ran 8 working days, inside the standard 6 to 10 working day window, because the build used existing hardware and no new tooling. The interesting outcome was not the sample itself but what the sample revealed about freight: the structured back panel made the packed parcel 28 cm tall, which billed at 6.7 kg of volumetric weight.
Our production team proposed folding the panel along a soft line rather than shipping it stuffed, and the second sample round confirmed the panel relaxed back to shape within 48 hours of unpacking. Packed height dropped to 17 cm and billed volumetric weight to 4.1 kg. On 1,187 parcels that single change was worth roughly 11,000 USD in freight.
This is the clearest argument in the whole case for involving the production partner in the freight decision. Nobody looking at a spreadsheet of courier rates would have found an 11,000 USD saving, because the saving came from a 3 cm change in how a panel folds. It required somebody holding the sample and somebody reading the rate card in the same conversation.
The sample round also settled the packaging specification. A single-wall carton at 32 ECT was rejected during drop testing after corner deformation appeared on the second drop. The specification moved to double-wall BC flute at 48 ECT, adding 0.62 USD per unit and removing most of the transit damage risk that would otherwise have surfaced as returns and replacements.
The second sample round also fixed a defect that would have been expensive. The first sample's strap adjuster slipped at roughly 4 kg of load. It was not visible, it was not caught by looking at the bag, and it would have generated field failures across the run. The hardware was upgraded to a cam adjuster at a cost of 0.34 USD per unit, which is a useful benchmark for how cheap it is to fix a functional fault at sample stage.
Freight architecture: two hubs and one direct lane
The two consolidation lanes carried 819 of the 1,187 parcels, roughly 69 percent. Consolidating them meant cartons travelled as freight rather than as parcels, were deconsolidated inside the region, and entered the domestic network as local parcels. The saving against individual international courier parcels was 34 percent into the United States and 41 percent into Europe.
Sea freight was chosen for the European lane and air freight for the United States lane, and the reasoning was purely about the calendar. The European lane had 26 weeks of slack before the promised delivery month, enough for 28 to 45 days of sea transit plus deconsolidation. The United States lane had 19 weeks, which comfortably fitted air freight at 9 to 16 days including handling.
The 368 remaining parcels went by direct courier or postal service. That split was decided by a threshold rule rather than by country: any destination with fewer than 45 backers went postal, anything above went courier. The rule is crude but it avoids the worst failure mode in tail shipping, which is spending three weeks negotiating a consolidation setup for 12 parcels.
One operational note that saved real money: the manifest for both hubs was generated from the same data set that produced the packing list and the labels. Nothing was retyped. Customs reconciliation on both lanes passed first time, and the campaign avoided the two to six day holds that routinely follow a mismatch between invoice lines and physical cartons.
Booking timing mattered as much as mode. The European sea freight was booked in week 11, four weeks before the goods were ready, which secured space without a premium. The United States air freight was booked in week 13 against a known completion date. Campaigns that wait until goods are finished to book freight routinely pay 15 to 30 percent more for the same lane, and in peak season they sometimes cannot book at all.
Duty strategy: where DDP paid for itself
The European lane was shipped DDP and the rest DDU. The decision was made on refusal arithmetic rather than on cost. Into the EU, an unexpected charge of 22 to 31 EUR on delivery produces refusal rates between 4 and 12 percent. At 415 parcels, a 6 percent refusal rate is 25 returned parcels at roughly 46 USD of wasted freight each, which is 1,150 USD plus 25 unfulfilled backers.
Paying duty and VAT up front cost the campaign about 9,400 USD of working capital held for seven weeks. Against that, it bought the removal of 25 refusals, no support queue about surprise charges, and no parcels returning to a warehouse that did not want them. On this campaign the trade was clearly worth it.
The United States, Canada, Australia, New Zealand and Japan stayed DDU, and refusal rates there came in below 1 percent. That is the expected pattern. Backers in those markets are accustomed to paying import charges on international orders and generally do not abandon parcels over them. Applying DDP globally would have tied up a further 6,000 USD for no measurable benefit.
Declared value was set at the pledge amount for each tier, not at a discounted figure. That is the correct treatment and it is worth repeating, because under-declaring is both fraud and, on a consolidated entry of 819 parcels, a risk that scales with the whole shipment rather than with one parcel.
The VAT treatment question is worth a separate note, because it was the campaign's third failure and the easiest to prevent. Thresholds and schemes change, and relying on a figure from a previous campaign or from an article is not sufficient. The fix was a 20 minute broker briefing in week 10, before dispatch documents were prepared, which would have cost nothing and prevented 812 USD of unplanned charges.
The nine month timeline, week by week
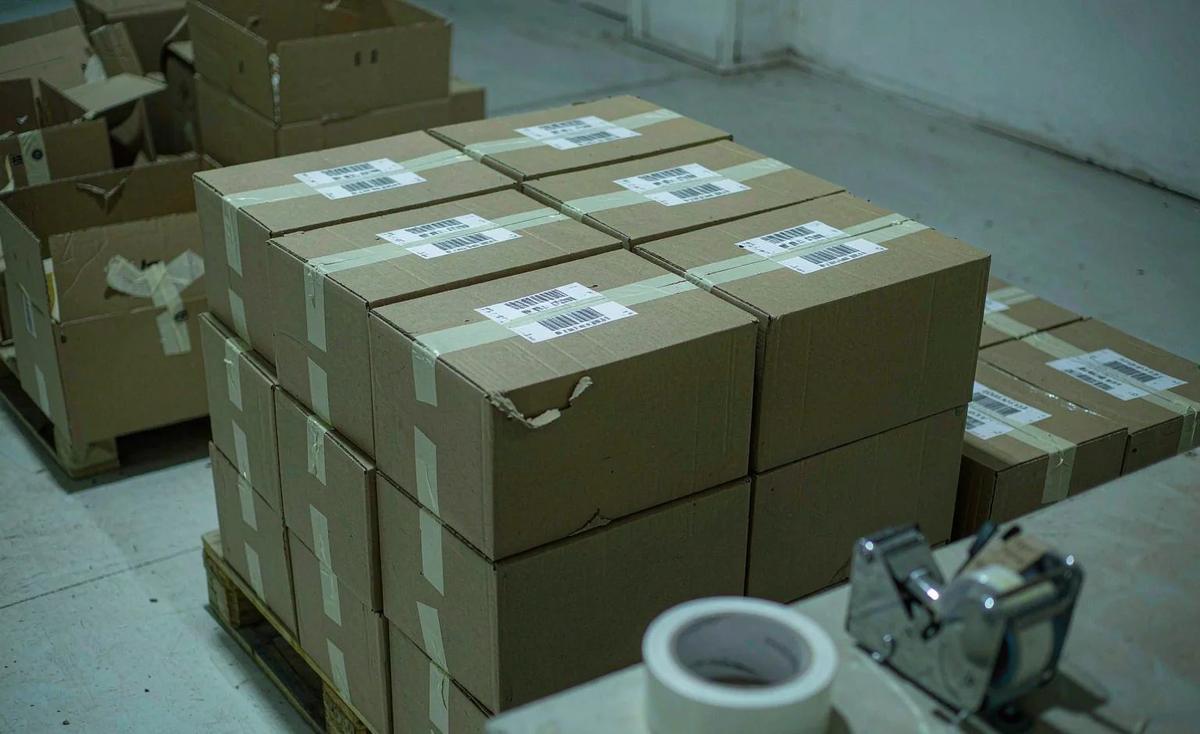
The campaign closed in week 0 with a delivery promise of month nine. Here is how the window was actually spent, and the striking thing is how little of it was production. Of 39 weeks, 6 were production and 33 were everything else.
| Weeks | Activity | Owner |
|---|---|---|
| 0 to 3 | Survey sent, two reminders, colourway default applied | Creator |
| 3 to 5 | Matrix frozen at 13 configurations, order placed | Creator and programme coordinator |
| 5 to 6 | Sampling, 8 working days, two rounds | Our production team |
| 6 to 7 | Sample approval, deposit paid under T/T 30/70 | Creator |
| 7 to 13 | Bulk production, 42 days | Our production team |
| Weeks | Activity | Owner |
|---|---|---|
| 13 to 14 | AQL 2.5 inspection, packing, carton drop test | Our production team |
| 14 to 18 | Sea freight to EU hub, air freight to US hub | Freight partner |
| 18 to 21 | Deconsolidation, domestic injection, tracking upload | Hub partners |
| 21 to 30 | Wave dispatch, support queue, replacement handling | Creator |
| 30 to 39 | Retail listing of 209 leftover units, warranty pool opened | Creator |
The two observations worth taking from that table are that survey management consumed three weeks that most campaigns do not budget for, and that inspection and packing consumed two weeks that are frequently compressed to nothing. Compressing those is how a campaign ships 800 parcels with a defect rate it did not intend.
The 39 week total also included six weeks of deliberate slack that were never used. That is not waste. A plan with zero slack converts every small slip into a missed promise, whereas a plan with slack converts the same slips into invisible internal adjustments. We generally recommend holding 4 to 6 weeks of unallocated slack at the end of the fulfilment window on a first campaign.
What went wrong, and what it cost
Three things went wrong. First, 62 padded straps were short against demand because the take rate on tier 3 came in at 41 percent against a forecast of 28 percent. The shortfall was covered from the loose attrition pool at a cost of 9 days and about 340 USD in air freight to move the straps to the US hub.
Second, 19 parcels into Brazil were held in customs for 23 days because the commercial invoice described the contents as "bag" rather than naming material, capacity and style number. The parcels were eventually released, but 6 backers had already requested refunds and the campaign absorbed 6 refunds at 89 USD each.
Third, a wave of 140 parcels into the European Union was dispatched with an outdated VAT treatment after a threshold change, and 34 backers received an unexpected bill. The campaign paid those bills itself, 812 USD in total, and the fix was a broker briefing that should have happened in week 10 rather than week 19.
A fourth issue is worth recording even though it cost nothing, because it is the one most campaigns share. For eleven days in week 24 no public update was posted while the Brazilian parcels sat in customs. The support queue did not grow, but the comment section did, and three of the six refunds traced back to backers who had read speculation rather than an update. Posting a short holding note in week 23 would have cost fifteen minutes.
Total cost of the three failures was roughly 1,686 USD plus six refunds, against a campaign reward revenue base that supported it comfortably. None of the three was exotic. All three were the result of decisions made too late rather than decisions made badly, which is the general lesson of campaign logistics.
Final cost per backer, by zone
The table below shows realised landed cost per parcel once fulfilment closed, including freight, duty where paid, handling, packaging and the share of failed deliveries. Product cost is excluded, because it is the same across zones, and so is the returns reserve, which is modelled separately.
| Lane | Parcels | Freight | Duty and tax | Total per parcel |
|---|---|---|---|---|
| United States, air consolidation | 404 | 11.20 USD | 1.40 USD | 14.30 USD |
| European Union, sea plus DDP | 320 | 16.80 USD | 14.90 USD | 34.10 USD |
| United Kingdom, hub plus DDP | 95 | 17.40 USD | 13.20 USD | 33.60 USD |
| Canada, direct courier | 71 | 18.60 USD | 3.10 USD | 23.40 USD |
| Australia and NZ, direct courier | 59 | 21.30 USD | 4.20 USD | 27.10 USD |
| Japan, direct courier | 47 | 19.10 USD | 2.40 USD | 23.20 USD |
| 24 country tail, postal | 191 | 15.70 USD | 2.90 USD | 20.30 USD |
The spread from 14.30 USD to 34.10 USD is the headline. Free worldwide shipping would have cost the campaign an average of 22.60 USD per backer, or roughly 26,800 USD across the run, which is more than the entire marketing budget. Per-zone shipping charges recovered 71 percent of it.
The second number worth noting is the 2.9 percent failed delivery and refusal rate, which came almost entirely from the postal tail. That is within the normal band and it is why the returns policy and the replacement pool were sized before dispatch rather than after.
The retail leg deserves a final number, because it is what changed the campaign's economics. The 209 leftover units sold at 78 USD against a marginal production cost near 21 USD, generating roughly 11,900 USD of contribution. That exceeded the cost of the extra 313 units and turned the MOQ rounding from a liability into the most profitable part of the whole campaign.
Five decisions that produced this outcome
Distilling the case to the decisions that actually moved the result, five stand out, and none of them required more money. They required making the decision earlier than felt necessary.
- Capping configurations at 13 before the campaign page was written, rather than promising unlimited mixing and discovering 48 combinations at survey close.
- Changing the fold on the back panel during sampling, which removed 2.6 kg of billed volumetric weight and about 11,000 USD of freight.
- Splitting into three lanes by backer density rather than shipping one global service, which cut freight 31 percent against the original estimate.
- Choosing DDP selectively, into markets with real refusal risk only, which tied up 9,400 USD but removed 25 refusals and their support load.
- Rounding up to 1,500 units across three colourways, which satisfied the 500 pcs per colourway minimum and produced retail stock rather than dead inventory.
Three of those five were made before the campaign launched. That is not a coincidence. Almost every expensive problem in crowdfunding logistics is a decision that was available early and deferred, and the cost of deferral is that later decisions have fewer options attached to them.
A sixth decision is worth adding even though it cost nothing at all: the campaign published a delivery month rather than a date. Every slip in this case study was absorbable because the published promise had a month of width in it. A campaign promising a specific date would have broken its promise three separate times on identical physical performance, and each break would have cost more in sentiment than the slip itself.
What we would do differently at 2,400 backers
Scaling this campaign to roughly double the backer count would change three things. The tail would shrink proportionally, because a larger campaign attracts more concentration, so the postal lane would likely cover fewer than 24 countries. Consolidation would extend to a third hub, probably in Asia-Pacific, once that region passed 250 parcels.
Production would change more than freight. At 2,400 backers across three colourways, every colourway clears 500 comfortably, so the rounding problem disappears and the leftover inventory question becomes a deliberate retail decision rather than a consequence of the minimum order quantity. Our programme coordinators would push for a fourth colourway only if retail sell-through supported it.
Two further changes would follow from scale rather than from anything going wrong. The replacement pool would move into two regional locations rather than one, because a domestic replacement at 8 to 22 USD beats an international one at 3 to 9 USD once claim volume passes roughly 40 per region per year. And the survey would carry an address confirmation step, since wrong addresses scale linearly with backer count and are the cheapest failure to prevent.
The one thing we would not change is the inspection gate. AQL 2.5 to ISO 2859-1 before dispatch cost this campaign 2 days and removed a defect class that would otherwise have produced between 18 and 48 claims at 20 to 40 USD each. Doubling the run doubles the value of that gate and does not double its cost.
Send us your backer count, destination mix and tier structure, and our campaign bag specialist will model the lanes and the order quantity before you commit.
Frequently Asked Questions
How long should a campaign allow from close to final delivery?
The campaign in this study promised a month and used 39 weeks, of which only 6 were production. Allow at least 3 weeks for survey management, 2 for sampling, 6 to 7 for bulk at 35 to 50 days, 2 for inspection and packing, and 8 or more for dispatch waves and support. Hold 4 to 6 weeks of unallocated slack at the end of the window, because a plan with zero slack converts every small slip into a missed promise.
How many shipping lanes does a 1,200 backer campaign need?
Usually three: consolidation into the largest market, a second hub if a second region exceeds roughly 250 parcels, and a postal or courier service for the tail. In this case three lanes carried 69 percent of volume by consolidation and cut freight 31 percent against an all-courier estimate. Book freight before goods are finished, since waiting until completion typically costs 15 to 30 percent more for the same lane.
What does DDP actually cost a campaign in working capital?
On this campaign, duty and VAT paid up front on the European lane totalled about 9,400 USD held for seven weeks. That bought the removal of an estimated 25 refusals at roughly 46 USD of wasted freight each, plus the support load that comes with backers receiving unexpected bills. Add a 20 minute broker briefing in week 10, because thresholds and schemes change and relying on last campaign's figures causes unplanned charges.
Is rounding up to the colourway minimum a mistake?
Not if the leftover has a use. This campaign ordered 1,500 against 1,187 backers because each colourway carries a 500 pcs minimum. About 104 units became the replacement and warranty pool and 209 sold at retail, recovering more than the cost of the extra units. Plan retail sell-through before you round up, because surplus without a route to market is dead stock rather than working capital.
How much can packing method change freight cost?
On this campaign, folding the back panel rather than shipping it stuffed cut packed height from 28 cm to 17 cm and billed volumetric weight from 6.7 kg to 4.1 kg. Across 1,187 parcels that was worth roughly 11,000 USD, found during sampling rather than during freight negotiation. Involve whoever holds the sample and whoever reads the rate card in the same conversation, since neither finds this saving alone.
What is a normal failed delivery rate on international reward shipping?
This campaign realised 2.9 percent, almost all of it in the postal tail. Bands of 2 to 5 percent are typical for bag rewards shipped internationally, which is why a replacement pool of 3 to 4 percent and a returns reserve of 4 to 7 percent of reward revenue belong in the budget. Track the rate by lane rather than overall, because failures concentrate in the postal tail and averaging hides where the fix belongs.
How many reward configurations should a campaign plan for?
This one realised 13 against a theoretical 48, because colourways were capped at three and add-ons were linked to tier. Between 9 and 18 configurations is comfortable for a packing operation without a warehouse system, and above 20 the error rate rises faster than the labour cost. Expect add-on take rates to diverge from forecast by 6 to 13 percentage points, and size the buffer on the item with the widest error.
How should non-responding backers be handled?
State a default colourway on the campaign page, send two reminders, then apply it. In this campaign 9 percent initially did not choose, and a stated default reduced the number actually taking the default to 31 backers out of 1,187, which removed a three week delay. Publish the default on the campaign page, because a default applied without notice reads as a substitution rather than as a process.
What causes customs holds on consolidated bag shipments?
Mostly vague descriptions. Nineteen parcels here were held 23 days because the invoice said bag rather than naming material, capacity and style number. Generating the manifest, packing list and labels from one data set also prevents the carton mismatches that hold whole entries. Name material, capacity and style number on the commercial invoice, and generate the manifest, packing list and labels from one data set.
Should inspection be skipped to save two days?
No. Inspection to AQL 2.5 to ISO 2859-1 cost 2 days and removed a defect class that would have produced 18 to 48 claims at 20 to 40 USD each. Doubling the run doubles the value of the gate without doubling its cost. Inspection is also where functional faults such as a slipping strap adjuster surface, and those are invisible to a visual check.
When does a third consolidation hub make sense?
When a region passes roughly 250 parcels, below which setup cost dominates. In this campaign Asia-Pacific was served direct because no single country exceeded 47 backers. At 2,400 backers the tail typically shrinks proportionally and a third hub becomes viable. Compare the hub handling fee of 0.80 to 2.40 USD per parcel against the freight saving before committing to a new region.
Can a campaign use sea freight and still hit its delivery promise?
Yes if the calendar allows. This campaign used sea freight for the European lane with 26 weeks of slack against 28 to 45 days of transit plus deconsolidation, and air freight for the United States lane with 19 weeks. Choose the mode from the calendar, not from habit. Book sea freight four weeks before goods are ready, which secures space without a premium and avoids peak season unavailability.
People Also Ask
How long does it take to deliver 1,200 bag rewards?
About 39 weeks from campaign close, of which only 6 are production. Survey management, sampling, inspection, freight and dispatch waves account for the rest, and compressing them is what produces defects and delays.
Is free worldwide shipping viable on a bag campaign?
Rarely. On this campaign the average landed cost per parcel was 22.60 USD across zones ranging from 14.30 to 34.10 USD. Per-zone shipping charges recovered 71 percent of that exposure.
How do you reduce freight cost on bulky light parcels?
Attack volumetric weight. Carriers divide cubic centimetres by 5,000, so reducing packed height matters more than reducing weight. One fold change here cut 2.6 kg of billed weight per parcel.
What is the biggest hidden cost in campaign fulfilment?
Survey management and returns. Surveys typically consume 3 weeks that campaigns do not budget for, and failed deliveries run 2 to 5 percent of parcels, each costing freight both ways plus support time.
Should a campaign order more bags than it has backers?
Often yes, because each colourway carries a 500 pcs minimum and replacements cannot be re-run economically. Order 3 to 4 percent above pledge count for the warranty pool, and plan retail sell-through for any further surplus.
What went wrong most often on this campaign?
An add-on shortage from an underestimated take rate, a customs hold from a vague invoice description, and an outdated VAT treatment on one dispatch wave. All three were decisions made too late rather than decisions made badly.
How do you decide between air and sea freight?
From the calendar. If a lane has more than about 20 weeks of slack, sea freight at 28 to 45 days plus deconsolidation is affordable. Below roughly 12 weeks, use air consolidation at 9 to 16 days.
Does inspection slow down fulfilment?
By about two days. It removes a defect class worth 18 to 48 claims at 20 to 40 USD each on a 1,200 unit run, which makes it the cheapest insurance available in the programme.