Crowdfunding a Bag Product: Market Research Before You Commit
Market research for a bag campaign has to answer four questions before you spend money: how many people will pay, what price, which features actually drive the decision, and whether the product can be made at that price at a 500 pcs minimum. Answer them with comparable campaign analysis, warm-list conversion, a three-point price test and a feature ranking exercise, then pressure-test the answer against feasibility. Research that skips the feasibility step produces a validated product nobody can deliver on schedule.
- What the research has to answer
- Reading comparable campaigns without copying numbers
- Demand signals that actually predict funding
- Price elasticity: the three-point test
- Feature ranking you can run in a week
- Sizing to a realistic backer count
- Feasibility research on the supply side
- The one-page brief that survives production
- Research mistakes that cost money
- Budget, tools and a two-week research plan
- When the research says stop

Research for a crowdfunding bag is not a report, it is a decision filter. Its job is to tell you whether to spend the next nine months on this product, and it earns its keep by saying no early rather than by confirming what you already hoped. Our team has supported 20+ crowdfunding campaigns, and the ones that shipped happily were usually the ones whose creators had already killed two other ideas on paper. The four questions below can each be answered in under a fortnight, and together they take a concept to a decision.
What the research has to answer
Write the four questions down before you open a browser, because research without a question produces trivia. How many people will pay is a unit-count question, and it has to be answered as a range with a pessimistic and an optimistic bound. At what price is a separate question, because demand at 89 US dollars and demand at 149 US dollars are different markets. Which features drive the decision tells you where to spend the unit cost. Can it be made at that price is the question most research skips, and it is the one that decides whether the campaign delivers.
Notice that none of these questions is about the total market for bags. Total addressable market is a number that impresses nobody and decides nothing. A category with two million potential buyers and no route to them is worth less than a community of 8,000 people who read one newsletter. Reachability is part of demand, not a separate marketing problem, and it should be measured in the same exercise as the desire to buy.
Set a decision rule before you start, and write it down. Something like: proceed if the pessimistic bound clears 600 units and the landed cost supports a 20% margin at the tested price; revise if the pessimistic bound is between 400 and 600; stop below 400. A rule written in advance stops you from reinterpreting the data to suit the answer you wanted. The full framework sits in the crowdfunding bag guide, and the production partner page explains how the feasibility half of it works.
Reading comparable campaigns without copying numbers
Find ten to fifteen bag campaigns in your category that closed in the last 24 months and build a table. Capture funding goal, amount raised, backer count, tier prices, tier count, delivery month promised, delivery month achieved, number of updates after funding, and the sentiment of the last twenty comments. Do not copy their headline number into your plan; the useful output is the distribution, not the best case, and the distribution tells you what a median outcome in your category looks like.
Read the comments, not the copy. The campaign page tells you what the creator hoped would sell. The comment section tells you what backers actually argued about, which is usually one of four things: a dimension that was missing, a delivery date that slipped, a feature that was expected and absent, or a colourway that was wanted. Every repeated question in those threads is a line item on your page and, more usefully, a line in your spec. Objections are free product research.
Then read the update history, which is the least flattering and most useful source. Count how many campaigns in your set published an update about a production or freight delay, and note where in the calendar it landed. If half of them slipped in the same month, that is a supply-side pattern rather than bad luck, and it tells you where to put your buffer. Our campaign timeline article maps the phases where those slips originate.
| Field | What it tells you | How to use it |
|---|---|---|
| Amount raised vs goal | Category funding multiple | Set a plausible goal, not an ambitious one |
| Backer count | Conversion scale at that price | Estimate your own backer count |
| Tier prices | Price band the category tolerates | Anchor your three-point price test |
| Tier count and mix | Which tier carries volume | Design your own ladder |
| Promised delivery month | What creators commit to | Benchmark your own promise |
| Achieved delivery month | Where schedules actually land | Place your time buffer |
| Update count after funding | Communication load | Plan your update cadence |
| Repeated comment questions | Unanswered objections | Turn them into spec and page lines |
| Colourway requests | Variant demand | Decide colourway count vs MOQ |
Demand signals that actually predict funding
Three signals predict a bag campaign outcome better than market size. Warm-list conversion is the strongest: the percentage of people who gave you an email address before launch and then pledged. A healthy range is 5-15%, higher for a tight community and a low price, lower for a broad audience and a premium one. Search volume on your category terms tells you whether demand exists outside your own audience, which matters because platform discovery supplies a large share of backers on most campaigns.
The third signal is engagement rate inside a community, and it is more predictive than community size. A subreddit of 60,000 members with a dozen active daily posters is a weaker signal than one of 12,000 with 200. Measure it: posts per week, comments per post, and how many people respond when someone asks a direct question about buying. That last measure is the closest thing to a purchase-intent survey that costs nothing.
Convert the signals into a number. If you can build a list of 6,000 people from reachable channels, conversion at 8% gives 480 backers from the list. If platform discovery historically adds 40-60% on top for your category, that is a further 200 to 290. Your pessimistic bound is roughly 480 and your optimistic bound is roughly 770. Now check the pessimistic bound against the 500 pcs per style and colourway minimum before you decide anything else, because a validated product below the minimum is not yet a validated programme.
Price elasticity: the three-point test
Price is the decision variable with the largest effect on your margin and the least reliable intuition behind it. Test three points rather than asking an open question. Pick a low point at roughly 0.8 times your intended price, the intended price, and a high point at roughly 1.25 times. Present the same product description to three comparable groups, or to one group in a randomised order, and ask the purchase-intent question at each point. The shape of the answer matters more than the level.
A bag category with flat elasticity between the low and high points is telling you the buyer is not price-led, which means you should price at the top and spend the extra margin on better materials. A category where intent collapses above the middle point is telling you there is a hard ceiling, and no amount of feature storytelling will move it. Most bag categories show a ceiling somewhere in the region of 1.3 to 1.6 times the retail price of a comparable mass-market item, and knowing where yours sits is worth weeks of work.
Run the test on people who resemble buyers, not on the general population. Fifty responses from members of the relevant community beats 500 from a generic panel. Ask the intent question in the language people actually use, such as how likely they would be to back this at that price, and always include the delivery month in the description, because a price tested without a delivery date is testing a different product. Then feed the result into the pricing strategy formula and check whether the winning price survives fees and postage.
Feature ranking you can run in a week
You cannot build every feature into a bag at a viable unit cost, so you need to know which ones carry the decision. Run a ranking exercise rather than a rating one. Give respondents a list of eight to twelve candidate features and ask them to pick the three they would most want and the one they would drop. Forcing trade-offs produces a real priority order, whereas asking people to rate each feature out of five produces twelve features all scored four.
Then cross-tabulate by price sensitivity. The features that appear in the top three of both price-sensitive and price-insensitive respondents are table stakes, and omitting them loses backers across the board. Features that only the price-insensitive group ranks highly are your premium differentiators, and they belong in the upper tier rather than the base product. This split is the most useful output of the whole research exercise, because it tells you where to spend unit cost and where not to.
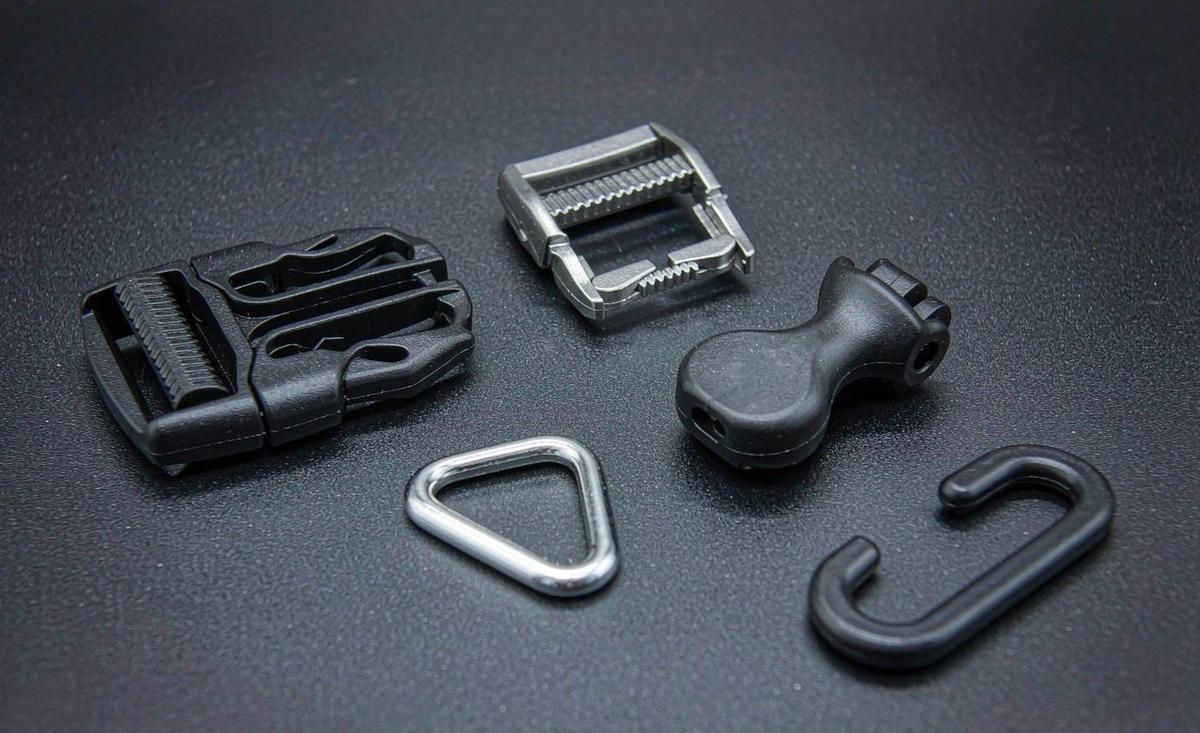
Close the loop with production. Take the top five features to your production partner and ask what each one costs in unit terms and what each one does to the sampling window. A feature that adds 1.50 US dollars and zero days is a clear yes. One that adds 6 US dollars and moves sampling from 6-10 working days to 12-15 working days needs to earn its place in the price. Our team returns that mapping as part of costing, and the sampling and prototyping pillar shows how component choices drive the window.
Sizing to a realistic backer count
Turn demand into a unit count in three steps. First, estimate reachable audience by channel and apply a sign-up rate to each, giving a pre-launch list size. Second, apply a conversion rate to that list, using the range you derived from comparable campaigns rather than the best case. Third, add a discovery allowance for platform traffic, which is real but volatile and should be treated as upside rather than as plan. The result is a range, not a number, and the low end of it is the one you plan production against.
Then apply the tier mix. If 60% of backers take a single unit, 30% take a bundle of two, and 10% take a premium tier with an accessory, then 500 backers produce roughly 710 units. That mix is not an assumption to make casually, it is a design target: the bundle tier is where unit volume comes from without extra backers, which is why the reward tier structure matters as much as the price does. Model three mixes and see which one clears the minimum at your pessimistic backer count.
Be honest about the discovery allowance. Platform discovery depends on category competition, page quality, press coverage and momentum in the first 48 hours, and it varies far more than warm-list conversion does. A reasonable planning approach is to include discovery at half of what comparable campaigns suggest you might get, and to treat anything above that as contingency rather than as plan. Campaigns fail when the plan depends on the optimistic half of a volatile number.
Feasibility research on the supply side
This is the half of the research that gets skipped, and it is the half that decides whether the campaign delivers. Before you commit, get a written indication of unit cost at your pessimistic volume, a statement of which features need custom tooling, an estimate of the sampling window, and a view on whether the product needs compliance testing. Those four answers convert a validated idea into a validated programme, and they take days rather than weeks if you have a spec.
Feasibility also has a schedule dimension. A product with a moulded component, a welded seam or a custom woven pattern samples in 12-15 working days rather than 6-10 working days, and produces in 35-50 days rather than at the short end of that band. If your delivery month is fixed by a season, such as a school bag that must arrive before term, the feasibility answer may rule the product out regardless of demand. Ask the schedule question at the same time as the cost question.
The last feasibility item is repeatability. Ask whether the product can be re-run without re-engineering, because a second run is where a campaign brand becomes a business. A bag built on stock components in a custom colourway re-runs cheaply. One built around a bespoke moulded part re-runs well too, but only after that tooling has been amortised. A one that depends on a hand-finished technique performed by two people does not scale, and that is worth knowing before you promise 1,000 units to backers.
The one-page brief that survives production
Collapse everything into one page, because a brief that survives contact with production is a brief someone will actually read. It should carry the positioning sentence, the target buyer and where they are reached, the three tested price points with the winner circled, the top five features with the two that are table stakes marked, the estimated backer count with a pessimistic and optimistic bound, the target landed cost, and the delivery month. One page, no appendices.
The discipline of one page has a practical effect: anything that does not fit is either not essential or not yet understood. A brief that needs four pages usually means the positioning is unresolved, and the resolution will happen later under time pressure. Put the two features you are willing to cut on the page as well, because costing will come back high on something and you will need a pre-agreed place to go that is not the price or the margin.
Then use the brief as the specification's parent. Every line in the eventual spec should trace back to a decision on that page, and any spec line that does not should be questioned. Our programme coordinator works from exactly this format, and a one-page brief with a spec attached gets a costing back in days. Send yours through the quote and enquiry page when the four questions are answered.
Add two dates that most creators omit: when the sample must be dispatched for the delivery month to hold, and when the freight booking has to be made. Both are derived from the schedule rather than chosen, and putting them on the page turns a vague intention into a commitment. They are also the two dates most likely to be missed.
Research mistakes that cost money
The first mistake is surveying the wrong people. Friends, family and generic panel respondents will tell you the product is good and the price is fair, and they are not the buyer. The second is asking rating questions instead of trade-off questions, which produces a feature list where everything is essential and nothing is prioritised. The third is testing price without the delivery month, which tests a product that ships immediately rather than one that ships in nine months.
The fourth mistake is treating comparable campaign totals as demand evidence. A campaign that raised a large amount may have done so with a huge pre-launch list, press coverage and a founder with an existing audience, none of which transfers to you. The fifth, and most expensive, is skipping the feasibility half. A product validated on demand and then found to need 12 US dollars more unit cost than the tier supports is a campaign that funds and then fails, which is worse than one that never launched.
There is also a subtle one: researching for longer than needed. Four questions answered in a fortnight is enough to decide. A three-month research phase produces marginally better answers and consumes the runway the campaign needed. Set a deadline at the start, answer the four questions, write the one-page brief, and move. If the answer is ambiguous after a fortnight, that ambiguity is itself a signal, and the honest reading is usually to choose the simpler product.
There is a matching set of things that are not mistakes. Changing the product after research is the research working, not a failure. Finding that your audience wants two colourways rather than four is a saving. And discovering that the category ceiling sits below your intended price is the most valuable output the exercise can produce, because it is far cheaper to learn in week two than in month six.
Budget, tools and a two-week research plan
Research does not need an agency or a budget measured in thousands. The tools are a spreadsheet, a landing page builder, one survey tool, a small paid social test on the channel you expect to use, and access to the communities where your buyer talks. The only genuinely paid item is the traffic test, and even that should be small: enough to produce a few hundred sign-ups and a cost-per-email figure you can extrapolate. Everything else is time, and the time budget should be capped at two weeks.
A workable ten-day plan looks like this. Days one and two: build the comparable campaign table and read the comments and update histories. Days three and four: set up the landing page and start driving traffic from one channel, with source tracking on every sign-up. Days five and six: run the three-point price test and the feature ranking to the list you have, plus posts in the two most relevant communities. Days seven and eight: size the backer count with pessimistic and optimistic bounds and check it against the minimum. Days nine and ten: get the feasibility indication and write the one-page brief.
Two things make the plan work. First, run the demand and price work in parallel rather than in sequence, because the price test needs a list and the list takes time to build, so start the landing page on day three regardless of what the comparable analysis says. Second, request the feasibility indication early, because a costing conversation is asynchronous and a question asked on day nine may not be answered until day twelve. Ask on day five and the answer arrives inside the window.
When the research says stop
Sometimes the honest answer is no, and recognising it early is the highest-return thing research does. The clearest stop signal is unit volume below the minimum at the pessimistic bound. If your low estimate is 380 units and the working minimum is 500 pcs per style and colourway, you have three options: grow the list, raise the price, or cut a colourway. If none of the three closes the gap in the time you have, the product is not ready and launching anyway means negotiating the minimum or cancelling after funding.
The second stop signal is margin that does not survive the landed cost. If the tested price ceiling is 99 US dollars and the landed cost at 500 units is 62 US dollars, the margin after fees and contingency is thin, and any slip in freight or postage turns it negative. That is not a reason to launch and hope, it is a reason to change the product: fewer panels, stock hardware, a simpler logo method. Re-cost it and re-test it, because a product that fits the price is a better outcome than a campaign that funds at a loss.
The third stop signal is a schedule that cannot meet the season. A school bag that cannot arrive before term, or a travel product that lands after the season, has a demand curve you cannot serve this year. Shift the launch by a full cycle rather than compressing production, because compressing a 35-50 day run is how quality problems and missed dates happen. Our team will say plainly if the month on your page is not achievable, and that answer is worth having before 800 people have pledged.
Send us the one-page brief and we will return unit cost, sampling window and a feasibility view before you commit to the campaign.
Frequently Asked Questions
How much market research do I need before a bag campaign?
Enough to answer four questions: how many people will pay, at what price, which features drive the decision, and whether it can be made at that price. That is roughly a fortnight of work using comparable campaign analysis, a warm-list conversion estimate, a three-point price test and a feature ranking exercise. Set the deadline before you start, because a three-month research phase consumes the runway the campaign needed.
How do I estimate how many backers my bag campaign will get?
Build a list estimate by channel, apply a sign-up rate to each, then convert that list at 5-15%. Add a discovery allowance for platform traffic at roughly half of what comparable campaigns suggest, and treat the rest as upside. Produce a pessimistic and optimistic bound rather than a single number, and plan production against the low end because a plan that depends on the optimistic half of a volatile number fails.
What is a good conversion rate from a pre-launch email list?
Plan for 5-15% of your pre-launch list converting to backers. The rate is higher for a tight community at a low price and lower for a broad audience at a premium price. If your tier price is 120 US dollars and your list is 6,000 people, expect somewhere between 300 and 900 backers from it. Measure sign-up rate and source for every entry so you know which channels produce converting backers.
How should I test the price for a bag reward?
Use a three-point test rather than an open question. Offer the product at roughly 0.8, 1.0 and 1.25 times your intended price to comparable groups, ask purchase intent at each, and look at the shape of the result. Flat intent across the range means the buyer is not price-led and you can price higher. A collapse above the middle point means there is a ceiling you must price below.
How many comparable campaigns should I analyse?
Ten to fifteen in your category that closed in the last 24 months. Capture goal, amount raised, backer count, tier prices and mix, promised and achieved delivery months, update count and the recurring questions in the comments. Use the distribution rather than the best case, and read the update history, because where comparable campaigns slipped tells you where to put your own time buffer.
Why should I read the comments on other campaigns?
The campaign page tells you what the creator hoped would sell; the comments tell you what backers actually argued about. Repeated questions about a missing dimension, an absent feature or a wanted colourway are free product research, and each one should become a line on your page and often a line in your specification. The update history is even more useful, because it shows where schedules actually landed.
What is feature ranking and how long does it take?
Give eight to twelve candidate features to people who resemble your buyer and ask them to choose the three they most want and the one they would drop. Forcing trade-offs produces a real priority order, unlike rating each feature out of five. It takes about a week. Then split results by price sensitivity: features everyone ranks highly are table stakes, and features only the price-insensitive group wants belong in an upper tier.
When should I check that the bag can actually be made?
As part of the research, not after it. Before committing, get an indication of unit cost at your pessimistic volume, a list of features needing custom tooling, an estimate of the sampling window and a view on compliance testing. A product validated on demand but needing 12 US dollars more unit cost than the tier supports is a campaign that funds and then fails, which is worse than not launching.
What should go in a one-page campaign brief?
The positioning sentence, the target buyer and where they are reached, three tested price points with the winner circled, the top five features with the table stakes marked, the backer count with pessimistic and optimistic bounds, the target landed cost and the delivery month. Add the two features you are willing to cut, because costing will come back high on something and you need a pre-agreed alternative to cutting margin.
What is the clearest signal that I should not launch yet?
Unit volume below the minimum at your pessimistic estimate. If the low end is 380 units and the working minimum is 500 pcs per style and colourway, you must grow the list, raise the price or cut a colourway. If none closes the gap in the time available, wait. Launching anyway means negotiating the minimum or cancelling after funding, and both outcomes damage the audience you built.
How does research change the sampling plan?
It tells you which features to sample first and which to leave out. Features needing moulded parts, welded seams or custom woven patterns move sampling from 6-10 working days to 12-15 working days. Cross-tabulating the feature ranking against price sensitivity tells you which of those expensive features are genuinely table stakes and which belong in a premium tier, so the first sample tests the right configuration.
Should I research the total market size for bags?
It is the least useful number in the exercise. Total addressable market impresses nobody and decides nothing, because reachability is part of demand. A community of 8,000 people who read one newsletter is worth more than two million potential buyers you cannot reach. Measure reachable audience, sign-up rate by channel and engagement rate inside communities instead, and convert those into a backer count.
People Also Ask
How long should bag market research take?
About a fortnight for the four core questions. Set a deadline before you start, because a longer phase consumes runway.
What conversion rate should I assume from my list?
5-15% of pre-launch sign-ups become backers, higher for a tight community at a low price and lower for a broad audience at a premium one.
How do I test my bag price?
Three points at roughly 0.8, 1.0 and 1.25 times your intended price, with the delivery month included in the description.
How many comparable campaigns should I study?
Ten to fifteen in your category from the last 24 months. Use the distribution, read the comments and the update history.
What is a table-stakes feature?
One that both price-sensitive and price-insensitive respondents rank in their top three. Omitting it loses backers across the board.
When do I check the bag can be made?
During research. Get unit cost at pessimistic volume, tooling needs, sampling window and compliance needs before you commit.
What is the clearest sign to wait?
Pessimistic unit volume below 500 pcs per style and colourway, with no way to close the gap by list growth, price or colourway count.