Bag QC Data: What a 95% Pass Rate Means for Your Campaign Promise
A 95 percent pass rate on a bag QC report does not mean 95 percent of your bags are good. It usually means 95 percent of the inspected units carried no defect above the acceptance threshold, from a sample that may be 50 units out of 2,000, with critical defects held at AQL 0 and minor defects allowed up to AQL 4.0. The honest reading requires three extra numbers: the sample size, the breakdown by defect class, and how many cartons were opened. This page explains what confidence a 50 unit sample actually gives you, how to convert a single percentage into a delivery promise you can defend, and which figures belong in your order documents.
- Where the 95 percent figure comes from
- Pass rate is not defect rate
- Sample size and the confidence behind a percentage
- Reading a pass rate across multiple lots
- Critical, major and minor hidden in one number
- What a 95 percent pass rate does not tell you
- Turning QC data into a delivery promise
- Lot history, switching rules and trend reading
- The numbers to write into order documents
- Reporting QC data to backers honestly
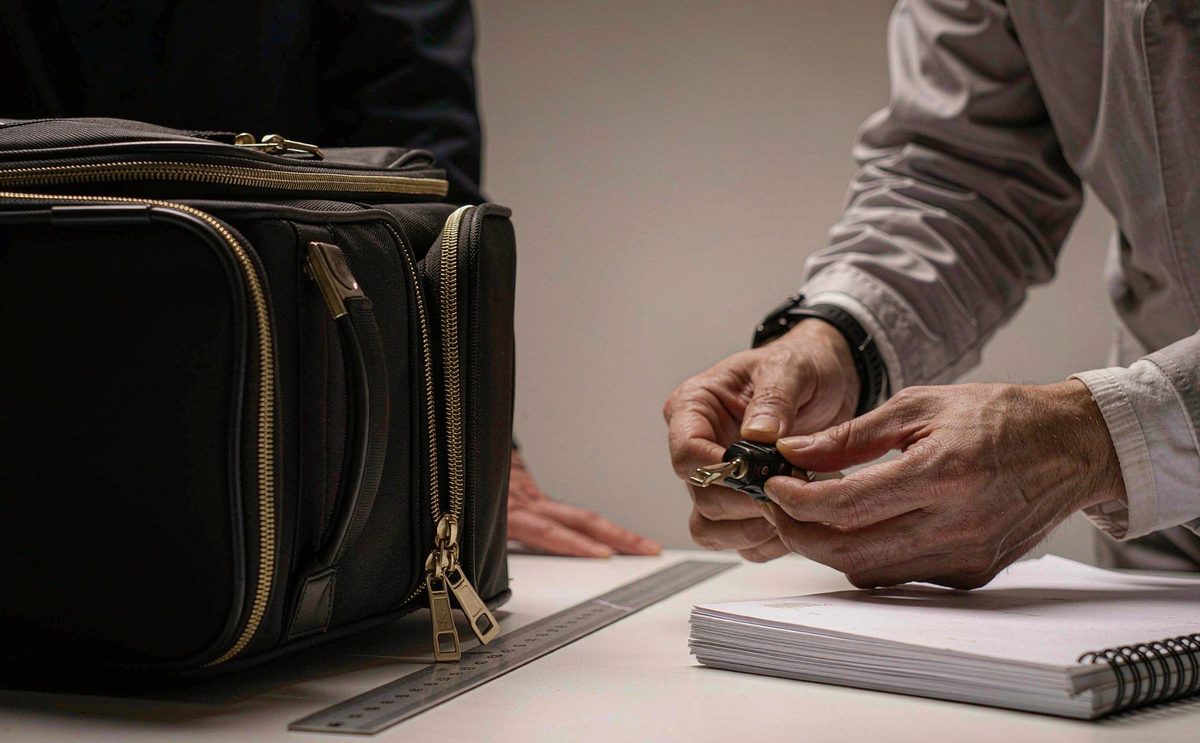
Where the 95 Percent Figure Comes From
The first question to ask about any pass rate is what was counted. In a reward bag programme the same 95 percent figure can be produced by four different calculations, and each one supports a different conclusion. A percentage quoted without its denominator is not data, it is a headline, and campaigns get into trouble by repeating a headline as if it were a measurement.
| Source of the figure | What it counts | What it hides |
|---|---|---|
| Inspection pass rate | Units in the drawn sample with no defect above the class threshold | Every unit never inspected, and every minor defect below threshold |
| Production line yield | Units finished without rework | Units reworked before they ever reached inspection |
| First pass yield | Units through the first station without fault | Faults introduced at later stations in the same line |
| Carton pass rate | Cartons accepted rather than units accepted | Defect clustering inside an accepted carton |
The distinction matters because the four figures are not interchangeable. A line yield of 95 percent means 5 percent of units needed rework, and if that rework was done well the delivered product may be better than the number suggests. An inspection pass rate of 95 percent is different: those units were found defective in a sample and the lot was still released because the count sat inside the acceptance number.
Our programme coordinator standardises on one definition across every programme we run, and states it on the report: pass rate means the share of inspected units in the drawn sample with no major or critical defect, with minor defects recorded separately. Without that sentence, two people reading the same report can reach opposite conclusions about whether the shipment is safe to send.
For the underlying mechanics of how a sample is drawn and how accept and reject numbers are set, see bag QC for Kickstarter: AQL 2.5 explained, which is the reference our inspectors work from on every lot.
Pass Rate Is Not Defect Rate
A unit can carry three minor defects and still be counted as a pass. A unit can carry one major defect and fail. Because of that, a pass rate of 95 percent is entirely compatible with a defect rate of 12 percent, if most of the defects are minor and scattered. This is not a flaw in the system, it is what the system is designed to do, but it means the percentage on the report cannot be read as a quality score.
Work the arithmetic on a standard plan. Under AQL 2.5 to ISO 2859-1 with general level II, a lot of 500 pcs draws 50 units and accepts up to 3 major defects. A lot that passes with exactly 3 majors has 6 percent of its inspected units defective, and the report can still describe the lot as accepted. Quote that lot as a 94 percent pass rate and it sounds reassuring; quote it as 3 major defects found in 50 units and it invites a different conversation.
- A pass counts a unit, while a defect counts a finding, so one unit can contribute several findings
- Minor defects at AQL 4.0 are permitted at a higher count than majors and do not fail the same way
- Rounding hides small samples: 2 defects in 50 units is 4 percent, and 3 in 50 is 6 percent
- A clean sample means no defects were found, not that no defects exist in the lot
- Defects cluster by carton and operator, so a random sample understates clustered faults
The practical instruction we give creators is simple: ask for the raw counts, not the percentage. Three numbers, being units inspected, major defects found, and minor defects found, tell you everything the percentage is trying to summarise, and they cannot be rounded into a more flattering shape. Our inspectors report raw counts on every lot for exactly this reason.
Classification is the other half of the problem, because a defect counted as minor when it should be major moves the lot across the acceptance line. Our page on acceptable defect tolerance on custom bags sets out how we classify common bag faults, and where a creator should insist on a stricter class.
Sample Size and the Confidence Behind a Percentage
Every percentage carries a confidence interval that widens as the sample shrinks, and the widening is dramatic at the sample sizes used in consumer goods inspection. A clean run of 50 units does not demonstrate a defect rate of zero. If the true defect rate in the lot were 5 percent, the chance of drawing 50 units and finding nothing is roughly 8 percent, which is low but far from impossible. A clean sample is weak evidence about a small defect rate.
| Sample size | Defect rate still consistent with zero findings | Practical reading for a reward programme |
|---|---|---|
| 20 units | Up to about 14 percent | Only useful for catching gross, obvious failures |
| 50 units | Up to about 6 percent | The standard AQL 2.5 plan for a 500 pc lot |
| 80 units | Up to about 3.7 percent | Appropriate for a larger lot or a second failure |
| 125 units | Up to about 2.4 percent | Premium tier above roughly 120 USD retail |
| 200 units | Up to about 1.5 percent | Full day inspection, materially higher inspection cost |
The table is the argument against over-reading a single report. A 50 unit sample is a reasonable commercial compromise, not a precision instrument, and it is the right choice precisely because inspecting 200 units per lot costs four times as much for a confidence gain most campaigns do not need. The answer is not to inspect everything, it is to inspect consistently and read the trend across lots rather than treating one report as a verdict.
Inspection cost scales with units inspected, because an inspector handles roughly 250 to 400 units per day depending on how detailed the checking protocol is. Our team quotes inspection as a day rate and states how many cartons will be opened, so a campaign can choose where on the confidence curve it wants to sit. On a first run we recommend staying at the standard plan and spending the difference on a midpoint in-line visit instead.
Carton coverage is a separate variable that reports often omit. Drawing 50 units from 3 cartons out of 40 gives a very different picture from drawing 50 units across 20 cartons, because defects cluster by carton. Our reports state cartons opened and cartons in the lot, and that line is the one to look at first when a lot passes with a suspiciously clean result.
Reading a Pass Rate Across Multiple Lots
One report is a snapshot, and a programme is a time series. The useful figure for a campaign is not the pass rate of the final lot, it is the weighted pass rate across every lot produced, weighted by lot size. A 2,000 unit programme split into four lots of 500 pcs produces four reports, and the honest programme figure is the total defects found divided by the total units inspected, not the average of four percentages.
Lot to lot variance is itself a signal. Four lots reporting 100, 96, 94 and 100 percent tell a different story from four lots reporting 97, 97, 98 and 98 percent, even though both sets average about 97 percent. The first set shows an outlier lot worth investigating, which usually corresponds to a material change, a new operator, or a production slot squeezed into a shorter window. The second set shows a stable process.
- Weight by lot size rather than averaging percentages, so a small clean lot cannot flatter the total
- Flag any lot more than 3 percentage points below the programme average for a written explanation
- Correlate the outlier lot against material lot numbers, because a fabric roll change is the usual cause
- Track whether defects concentrate at the start, middle or end of a run, which points to fixture or fatigue
- Keep the inspection history with the specification so a second campaign starts from evidence
Our production team keeps that history per programme and reviews it before quoting a second run, because it is the fastest way to identify which specification line needs tightening. A campaign that skipped inspection on run one has no baseline at all, which means run two is also a guess, and the guess gets more expensive as volume grows.
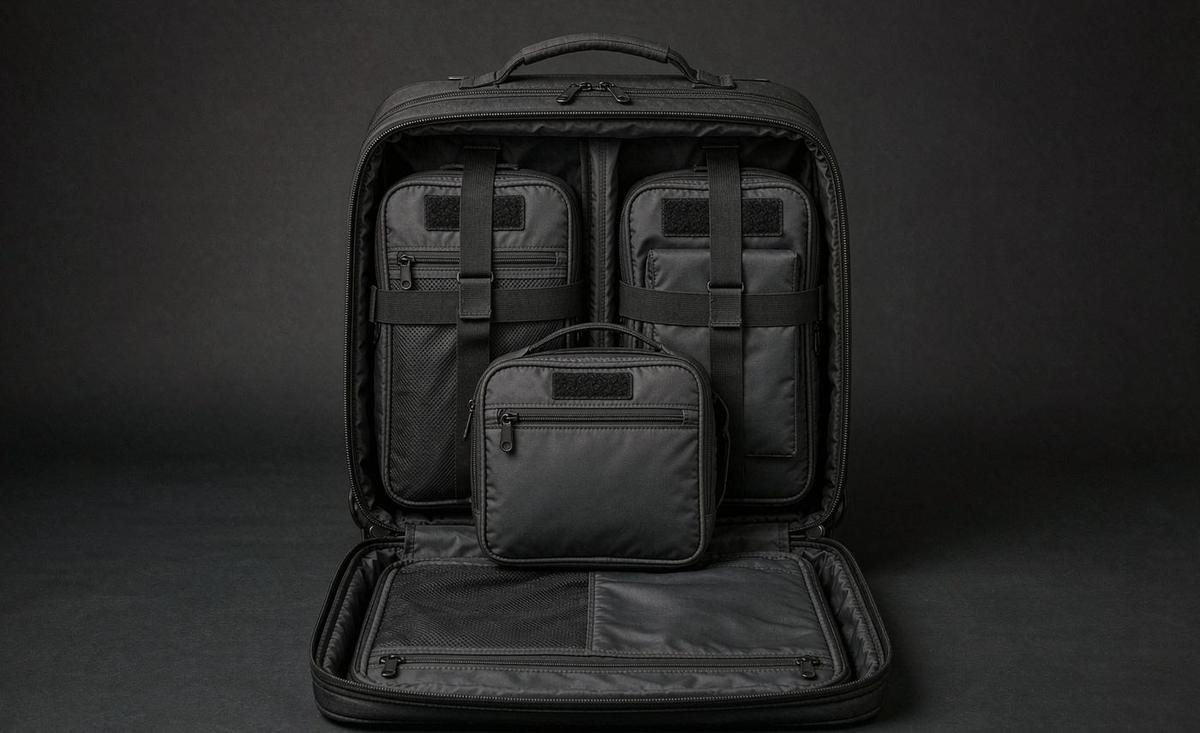
Critical, Major and Minor Hidden Inside One Number
A single pass rate collapses three separate acceptance levels into one figure. Critical defects run at AQL 0, meaning any critical finding fails the lot outright. Major defects run at AQL 2.5, and minor defects at AQL 4.0. A lot can therefore pass with zero criticals, three majors and five minors, and be summarised as a 94 percent pass rate, which is technically accurate and practically misleading.
| Class | Acceptance level | Typical bag examples | Effect on the release decision |
|---|---|---|---|
| Critical | AQL 0 | Sharp exposed hardware, broken needle fragment, choking hazard on a child item | Lot fails on a single finding |
| Major | AQL 2.5 | Strap not bar tacked, zipper split, seam burst, logo badly misplaced | Lot fails when the count exceeds the accept number |
| Minor | AQL 4.0 | Loose thread, light soiling, slight print offset within tolerance | Recorded, usually does not fail the lot |
The classification is not cosmetic. A strap without its bar tack is a major because it will fail in use, while a loose thread is a minor because it will not. But a creator selling a premium technical bag may reasonably want that loose thread treated as a major, because the audience expects finishing quality at that price point. Classification is a commercial decision as much as a technical one, and it should be written into the order.
Our inspectors work from a written classification list agreed before inspection starts, and that list is part of the specification pack. Where a campaign wants a stricter list, we apply it and note it on the report, because an agreed stricter list prevents the argument that always arises when a creator sees a defect on a delivered bag that the report counted as acceptable.
If you want to understand what a report looks like in practice before you commission one, read how to read a bag QC report, which walks through a real report line by line.
What a 95 Percent Pass Rate Does Not Tell You
The value of a quality number is partly in knowing its limits. Sampling inspection is a release decision tool, and there are whole categories of risk it does not address. Naming those categories explicitly is what separates a campaign that handles a problem calmly from one that is surprised by it in month three of delivery.
- Durability over time: a bag that passes on day one can fail at month six from abrasion or UV exposure
- Compliance: fibre content, care labelling and substance restrictions are tested separately from inspection
- Colour accuracy: a pass confirms the bag matches the golden sample, and says nothing about the campaign render
- Shipping damage: inspection happens before the container closes, not after a 30 day sea transit
- Packing accuracy: tier and colourway errors are a fulfilment control, not an inspection finding
- Backer expectation: a perfectly built bag still generates returns if the listing overstated capacity
Each of those six needs its own control, and none of them is improved by tightening the AQL. Durability is addressed with material testing and a cycle test on hardware. Compliance is addressed with a documentation file and, where needed, third party testing. Colour accuracy is addressed with a signed golden sample. Shipping damage is addressed with a carton specification. Packing is addressed with a scan at carton close. Expectation is addressed on the campaign page.
This is the reason our bag QC and compliance hub for Kickstarter campaigns separates inspection from compliance and from fulfilment. A 95 percent pass rate is a statement about one of those three areas, and campaigns get hurt when they read it as a statement about all three.
Turning QC Data Into a Delivery Promise
The reason any of this matters is that a campaign has to make a public promise. Backers are told a delivery month, and the promise is only defensible if it rests on numbers rather than optimism. QC data is one of the three inputs to that promise, alongside the production calendar and the freight transit time, and the three should be combined with explicit buffers rather than stacked at their best case.
- Take the bulk production window of 35 to 50 days and plan against the upper end, not the lower one
- Add sampling time of 6 to 10 working days, or 12 to 15 working days for a complex build with moulded panels
- Add inspection and any re-work time, which is typically 1 to 2 working days plus re-work if the lot fails
- Add freight transit and customs clearance for the destination with the longest realistic clearance time
- Add a fulfilment window for address collection, labelling and handover to the parcel carrier
- Publish a month rather than a date, and state the assumptions behind it on the campaign page
The re-work step is where QC data changes the promise. A lot that fails inspection needs re-work and re-inspection, which can add 7 to 14 days to the calendar, and that risk is real rather than theoretical on a first run with a new specification. Building that allowance into the published month is far cheaper than explaining a two week slip to 2,000 backers.
Our programme coordinator publishes the calendar with those buffers shown as separate lines, so a creator can see exactly what the month is made of. Quotations are issued FOB Xiamen with T/T 30/70 terms, which means the calendar after handover belongs to the freight forwarder rather than to our production team, and that boundary should be visible in the published plan.
Lot History, Switching Rules and Trend Reading
ISO 2859-1 includes switching rules that move a programme between normal, tightened and reduced inspection based on recent history. In plain terms, a run of accepted lots can qualify for reduced inspection, while a run of rejected lots forces tightened inspection with larger samples. Those rules are the formal version of the trend reading described earlier, and they are worth understanding because they change how much inspection costs over a programme.
Reduced inspection sounds attractive and is often a mistake for a one-off campaign. It reduces sample size, which widens the confidence interval precisely when the programme has the least history to lean on. Our default is to hold at normal inspection across a first campaign and to move to tightened inspection after any rejected lot, rather than to chase the cost saving of reduced inspection on a short run.
- Normal inspection is the default, using general level II and AQL 2.5 for major defects
- Tightened inspection applies after a rejected lot, with a larger sample and a lower accept number
- Reduced inspection is available after a consistent run of accepted lots, and we rarely recommend it for campaigns
- Switching back to normal requires a qualifying run of accepted lots under tightened inspection
- Any material or process change resets the history, because the previous results no longer describe the process
That last line is the one campaigns miss. Changing a fabric supplier, a zipper brand or a colourway mid-programme resets the evidence base, and inspection should return to normal on the first lot after the change. Our team flags any such change in the lot record specifically so the switching logic is applied correctly rather than inherited from a previous configuration.
Scheduling the checks around these rules is covered in in-line versus final inspection, and the release gate itself is described in pre-shipment inspection for Kickstarter bags.
The Numbers to Write Into Order Documents
Everything on this page reduces to a short list of figures that should appear in the order document rather than in an email thread. When these numbers are written down, a dispute becomes a measurement. When they are not, a dispute becomes an argument about what someone meant, and arguments are resolved slowly and expensively during a delivery window.
- Inspection standard
- ISO 2859-1, general level II, single sampling
- Critical defect level
- AQL 0
- Major defect level
- AQL 2.5
- Minor defect level
- AQL 4.0
- Report must state
- Units inspected, cartons opened, cartons in lot, defects by class
- Pass rate definition
- Inspected units with no major or critical defect
- Sampling window
- 6 to 10 working days, complex builds 12 to 15 working days
- Bulk window
- 35 to 50 days
- Minimum order
- MOQ 500 pcs per style and colourway
- Commercial terms
- FOB Xiamen, T/T 30/70
Two lines in that list do more work than the rest. Requiring the report to state cartons opened converts a headline percentage into an auditable result, and defining pass rate in writing prevents the same report being read two ways by two people. Both cost nothing to add and remove most of the ambiguity that makes QC data feel unreliable.
Where a campaign wants a stricter plan, the change is equally simple: name a larger sample size or a lower acceptance level, and accept the inspection cost that follows. Our sourcing partner quotes both options side by side, because the decision is a commercial trade between inspection spend and return exposure, and the return cost model should drive it.
Reporting QC Data to Backers Honestly
Creators often ask whether to publish inspection results. The short answer is that publishing a percentage is risky and publishing a process is safe. A backer reading 95 percent pass rate forms the wrong impression, while a backer reading that every lot was inspected to ISO 2859-1 with critical defects at zero tolerance forms the right one, and both statements describe the same programme.
When a lot does fail, communicate it as a process outcome rather than as a crisis. State that the lot did not meet the agreed standard, that it is being re-worked, and what the revised delivery estimate is. Backers respond well to a named cause and a named date, and badly to silence followed by a slip. Our campaign bag specialist recommends a single update with three sentences rather than a long explanation.
The final discipline is to keep the evidence. Retain the inspection reports, the signed golden sample, the specification sheet and one labelled reference unit per lot, indexed by lot number and date. When a backer raises a concern months later, that file answers the question in an afternoon rather than reopening it with the workshop, which is the practical value of treating QC data as a record rather than as a gate.
Send your lot sizes, tier count and target delivery month for an inspection plan quote. Our campaign bag specialist will specify sample sizes and defect classes, or reach us at service@junyuanbags.com.
Key takeaways
- A pass rate counts units passed, while a defect rate counts findings, and the two are not the same number
- A clean 50 unit sample cannot rule out a defect rate of about 6 percent
- Critical at AQL 0, major at AQL 2.5, minor at AQL 4.0, reported separately
- Weight pass rate by lot size across the programme rather than averaging percentages
- Sampling 6 to 10 working days, complex 12 to 15 working days, bulk 35 to 50 days
- MOQ 500 pcs per style and colourway, FOB Xiamen, T/T 30/70
Frequently Asked Questions
What does a 95 percent pass rate actually mean on a bag QC report?
It means 95 percent of the inspected units in the drawn sample carried no defect above the acceptance threshold. It is not a statement that 95 percent of all bags in the lot are good, because the sample may be 50 units out of 2,000 and minor defects below threshold still count as a pass. Ask for raw counts: units inspected, cartons opened, and defects by class.
Can a lot pass with a 6 percent defect rate?
Yes. Under AQL 2.5 to ISO 2859-1 with general level II, a lot of 500 pcs draws 50 units and accepts up to 3 major defects. Three majors in 50 units is 6 percent of the sample, and the lot is still released. That is why the percentage on the report should never be read as a quality score without the raw counts beside it.
How much confidence does a 50 unit sample give?
A clean run of 50 units is still consistent with a true defect rate of about 6 percent at 95 percent confidence. If the real rate were 5 percent, the chance of drawing 50 clean units is roughly 8 percent, which is unlikely but not rare. Larger samples narrow the interval: 125 units brings the upper bound to about 2.4 percent.
Should I pay for a larger sample size?
Usually not on a first campaign. Inspection cost scales with units inspected, and an inspector handles roughly 250 to 400 units a day. Spending the difference on a midpoint in-line visit during bulk prevents more defects than enlarging the final sample, because in-line checking changes what is still being made rather than judging finished goods.
Why does my report show 95 percent when the bags look fine?
Because minor defects at AQL 4.0 are recorded but do not fail the lot, and one unit can carry several findings. A bag with three loose threads is a pass with three defects recorded. If your audience expects premium finishing, ask for those defects to be reclassified as major in the agreed classification list.
How do I combine pass rates across several lots?
Weight by lot size rather than averaging percentages. Add total defects found across all lots and divide by total units inspected. Averaging percentages lets a small clean lot flatter the programme figure. Also flag any lot more than 3 percentage points below the programme average, because an outlier lot usually points to a material change.
Do switching rules apply to a one-off campaign?
They apply technically, but we hold at normal inspection across a first campaign. Reduced inspection after a run of accepted lots widens the confidence interval exactly when you have the least history, and the cost saving is small on a short run. We move to tightened inspection after any rejected lot until a qualifying run passes.
What does inspection not cover?
Durability over months of use, regulatory compliance such as fibre content and substance limits, colour accuracy against your campaign render, damage during sea or air transit, packing accuracy by tier, and backer expectation set by your listing copy. Each of those needs its own control and none improves by tightening the AQL.
How should I build a delivery promise from QC data?
Stack named blocks with buffers: sampling 6 to 10 working days or 12 to 15 for complex builds, bulk 35 to 50 days planned at the upper end, inspection and possible re-work of 1 to 2 days plus 7 to 14 if a lot fails, then freight, clearance and fulfilment. Publish a month with the assumptions stated.
Should I publish my inspection results to backers?
Publish the process, not the percentage. Saying every lot was inspected to ISO 2859-1 with critical defects at zero tolerance is accurate and reassuring. Saying 95 percent pass rate invites the wrong interpretation. If a lot fails, name the cause, say it is being re-worked, and give a revised date in three sentences.
What numbers belong in the order document?
Inspection standard ISO 2859-1 general level II single sampling, critical at AQL 0, major at AQL 2.5, minor at AQL 4.0, and a requirement that the report states units inspected, cartons opened, cartons in the lot and defects by class. Add a written definition of pass rate and the agreed defect classification list.
How long does inspection take and what does it cost?
A final inspection typically takes 1 to 2 working days depending on sample size, quoted as a day rate with the carton coverage stated. An inspector handles roughly 250 to 400 units per day depending on protocol depth. Our team quotes sample size and carton coverage together so you can choose where on the confidence curve to sit.
People Also Ask
Is a 95 percent pass rate good for bags?
It is a normal result for a released lot, but it is not a quality score. It means 95 percent of inspected units had no major or critical defect, from a sample that may be 50 units.
What is the difference between pass rate and defect rate?
Pass rate counts units that passed, while defect rate counts individual findings. One unit with three minor defects is one pass and three defects.
How many bags should be inspected in a 2,000 unit order?
Under ISO 2859-1 general level II the sample depends on lot size, with 50 units typical for a 500 pc lot. Larger lots draw larger samples.
Can a lot pass inspection and still have defective bags?
Yes. Sampling reads a subset and defects cluster by carton and operator, so uninspected units can carry faults that the sample did not draw.
What is AQL 0 used for?
Critical defects. Any single critical finding, such as an exposed sharp part or a broken needle fragment, fails the lot outright with no accept number.
Does a higher inspection sample reduce returns?
It narrows the confidence interval but does not address durability, packing errors or expectation mismatch, which cause a large share of returns.
How do I read a QC report quickly?
Look at cartons opened first, then units inspected, then the critical count, then majors against the accept number, and ignore the headline percentage.