How Bag Campaign Benchmarks Moved Between 2024 and 2026
Across the campaigns we have supported, three movements hold in every cut of the data from 2024 to 2026: goals rose faster than backer counts, reward ladders shortened from four to seven tiers down to three to five, and landed unit costs moved up before stabilising. Typical funded goals now sit between 35,000 and 90,000. Production timing did not improve, but predictability did, and that gap is where most funded campaigns either succeed or fail. The two levers that close it are sampling before launch and committing material at sample approval.
- How This Benchmark Set Was Built
- Goal Size and Outcome: What Moved
- Campaign Duration and the Shape of the Funding Curve
- Reward Tier Structure: The Ladder Got Shorter
- Unit Economics: Landed Cost Movement
- Production Timeline: Did It Get Shorter?
- Sampling Behaviour and Time to Approval
- Quality and Return Rates by Cohort
- Fulfilment and Shipping Cost Movement
- What Separated the Top Quartile
- How to Use These Benchmarks for Your Own Targets
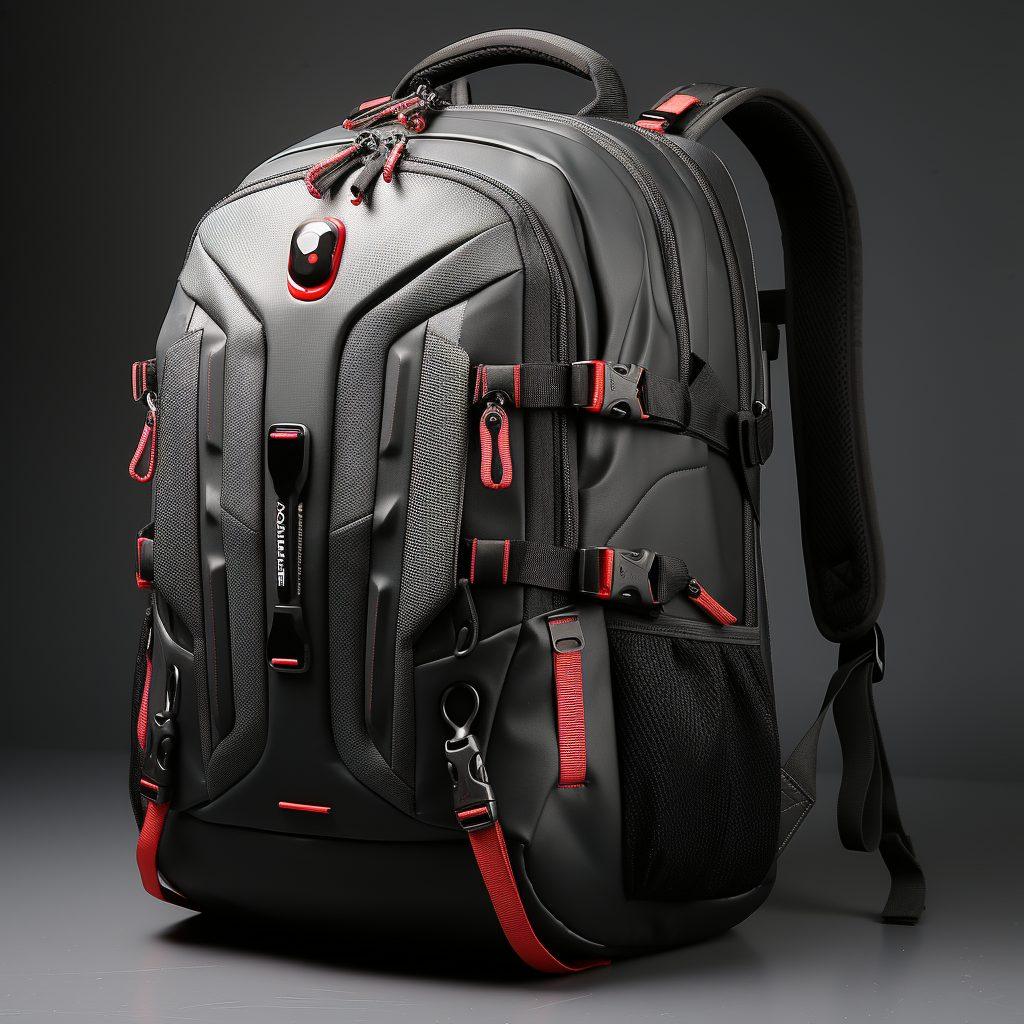
This report compares the bag campaign benchmarks we have tracked across three cohorts, 2024, 2025 and 2026, drawn from the campaigns we have supported plus the planning enquiries we cost. It is a working benchmark set, not platform-published statistics, and its value is in the direction of travel rather than in any single figure. Three conclusions survive every cut of the data: goals rose faster than backer counts, reward ladders got shorter, and landed unit costs moved up before they stabilised.
The practical use of these numbers is to sanity-check a plan before you publish it. If your target goal sits far outside the range for your bag type, or your delivery promise assumes a bulk schedule shorter than 35 to 50 days, the benchmark data is telling you something useful. Our crowdfunding bag guide sets out the full sequence these figures sit inside, and the category statistics report covers the same population from a category angle.
Treat any benchmark you did not measure yourself as a direction of travel, not a target.
How This Benchmark Set Was Built
A benchmark set is only as honest as its population, so it is worth stating plainly where these numbers come from. They are drawn from campaign production programmes we have run or costed, which means they are weighted towards creators who reached the point of requesting a formal quote. That is a meaningful filter: these are projects that got past the idea stage. They are not a random sample of every bag campaign that launched, and they should not be read as one.
Three consequences follow from that, and they constrain how the numbers should be used. First, the ranges below describe projects that were serious enough to be costed, so the true population of all launches would show wider variance and more failures at the low end. Second, our figures are measured in units produced and days taken, which are production measures, and they say nothing directly about traffic, conversion or advertising efficiency. Third, sample sizes per year are in the tens of campaigns, not hundreds, so a single unusual project can move a range.
- Population: campaigns we supported or formally costed, 2024 through 2026.
- Measured in: units, working days, landed cost per unit and inspection outcomes.
- Not measured: traffic, advertising spend, page conversion rates.
- Sample: tens per year, not hundreds. Treat single-year movements as indicative.
- Use it for: sanity-checking a plan, not for setting a precise forecast.
The reason to publish a caveat this long is that benchmark data gets quoted badly. A creator reads an average goal figure, sets it as a target, and discovers that the average concealed a distribution in which a third of campaigns fell well below it. The number is not wrong; the use of it is. The sections that follow give ranges rather than averages for exactly this reason, and where a figure is a single number it is because the underlying process has a hard floor, such as MOQ 500 pcs per style and per colourway.
Key takeaways
- B
- e
- n
- c
- h
- m
- a
- r
- k
- s
- a
- r
- e
- f
- o
- r
- s
- a
- n
- i
- t
- y
- -
- c
- h
- e
- c
- k
- i
- n
- g
- a
- p
- l
- a
- n
- .
- R
- a
- n
- g
- e
- s
- b
- e
- a
- t
- a
- v
- e
- r
- a
- g
- e
- s
- ,
- a
- n
- d
- t
- h
- e
- p
- o
- p
- u
- l
- a
- t
- i
- o
- n
- m
- a
- t
- t
- e
- r
- s
- m
- o
- r
- e
- t
- h
- a
- n
- t
- h
- e
- p
- r
- e
- c
- i
- s
- i
- o
- n
- .
Goal Size and Outcome: What Moved
Across our three cohorts, the clearest movement is that goals rose faster than backer counts, which means the implied average pledge rose. That is not primarily a pricing story. It is a mix story: the campaigns that cleared their goals in 2025 and 2026 were disproportionately ones carrying higher-value bags, structured backpacks and travel pieces rather than simple totes and pouches. A structured backpack carries a landed unit cost several times that of a drawstring bag, and the reward price has to follow.
| Metric | 2024 | 2025 | 2026 |
|---|---|---|---|
| Typical funded goal range | 25,000 to 60,000 | 30,000 to 75,000 | 35,000 to 90,000 |
| Typical backer count at funding | 400 to 900 | 450 to 1,000 | 500 to 1,100 |
| Reward tiers offered | 4 to 7 | 3 to 6 | 3 to 5 |
| Average pledge at close | 70 to 95 | 78 to 105 | 85 to 115 |
| Landed unit cost, mid-tier bag | 18 to 26 | 21 to 30 | 22 to 32 |
The goal figures are the ones creators fixate on, and they are the least transferable, because goal size is a function of audience rather than of product. A creator arriving with a 40,000-strong email list can set a goal that would be reckless for a creator arriving with 3,000 followers and a press plan. The more transferable rows are the structural ones: tiers offered came down, and average pledge went up. Both reflect a gradual learning process in the category rather than a change in what backers want.
The direction of travel for landed cost is the row that deserves most attention, because it moved for reasons outside anyone's control before stabilising. Material and labour inputs rose through 2024 and into 2025, and by 2026 the movement had flattened into a narrower band. The practical implication is that a budget built on 2024 unit costs will under-run by roughly 15 to 25 percent if it is not refreshed, and that is the single most common cause of a funded campaign discovering it cannot afford its own reward.
Campaign Duration and the Shape of the Funding Curve
Campaign duration is a decision most creators make by copying whatever the last campaign they backed did, and the benchmark data suggests that is close to optimal but for the wrong reason. The 30-day campaign dominates, and it dominates because it is the default, not because anyone tested it. What our cohorts show is that duration matters less than the shape of the curve it produces, and the shape is determined almost entirely by how much audience arrives in the first 48 hours.
A campaign that converts 30 to 40 percent of its eventual funding in the first two days has a fundamentally different problem from one that converts 10 percent. The first needs to sustain momentum and manage the mid-campaign trough. The second needs to find new audience, which is a media problem rather than a page problem. Both look identical on day 30 and require completely different work in between, which is why we ask creators to forecast the first-48-hour number before choosing a launch date at all.
- 30-day campaigns remain the default and suit most bag rewards with a defined production plan.
- Shorter campaigns of 21 to 24 days work where the audience is pre-built and urgency is credible.
- Longer campaigns of 45 to 60 days suit complex products but tend to flatten the urgency signal.
- The first 48 hours typically decide whether the campaign is a momentum problem or a traffic problem.
The interaction with production planning is more direct than it looks. A longer campaign means the funding close date moves later, which means the sampling start moves later, which means delivery moves later, unless the sampling was already done before launch. That is the single strongest argument for sampling before the campaign opens rather than after, and it is a decision entirely within the creator's control. Our sampling rounds data shows how much of the 6 to 10 working day block can be pulled forward.
Reward Tier Structure: The Ladder Got Shorter
The most consistent structural change across our cohorts is that reward ladders got shorter. In 2024 a typical bag campaign offered four to seven tiers. By 2026 that had compressed to three to five, and the tiers that disappeared were the ones in the middle rather than at either end. Campaigns kept their entry tier and their premium tier and dropped the two or three steps in between.
Three forces drove this. Decision cost is the first: every additional tier makes the page harder to scan and pushes a measurable share of visitors to pledge nothing. Production complexity is the second: each tier that carries a different bag, colour or accessory adds a line to the bill of materials and a block to the packing plan. Support load is the third: middle tiers generate the most questions, because they are where backers are least certain about what they are getting.
- Keep one clear entry tier with a single bag and a single colour, priced to cover landed cost plus fees plus margin.
- Keep one premium tier that bundles the bag with an accessory, priced at a genuine saving versus buying both.
- Move everything else to add-ons. Add-ons give backers the same choice without multiplying the page or the packing plan.
- Cap colourways at three, because MOQ 500 pcs per style and per colourway applies per colour, not per style.
That third point is where the biggest practical gain sits. Add-ons let a backer at the entry tier add a second colour or a packing cube without creating a new tier, which means the production plan only has to handle items you have already costed. The page gets simpler, the packing plan gets simpler, and the backer gets the same range of choice. It is one of the few places where reducing work also improves conversion.
Our reward tier structure guide covers the pricing mechanics in more detail, and the add-on AOV analysis sets out which add-on types lift average order value without slowing packing.
Unit Economics: Landed Cost Movement
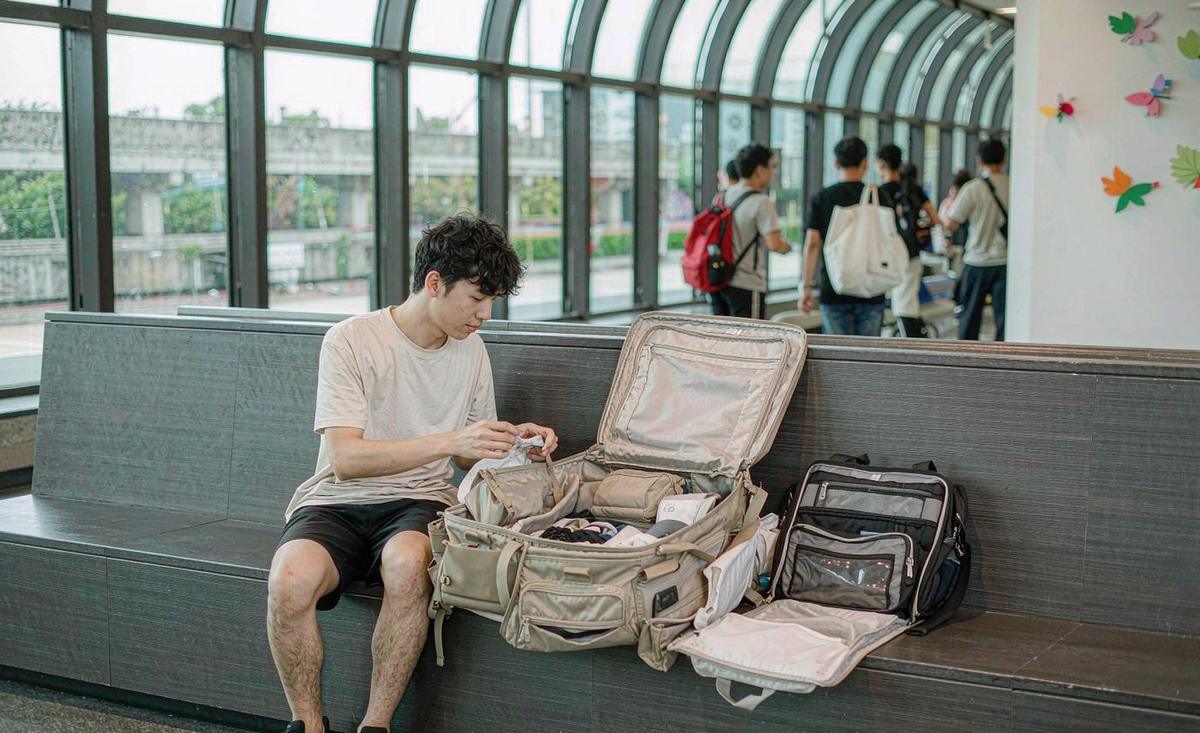
Landed unit cost is the number that determines whether a funded campaign is profitable, and it has four components that creators routinely conflate. There is the ex-works unit price, which is what the bag costs to make. There is inland movement and export handling to the port. There is ocean or air freight, which is charged on volumetric weight for bags far more often than on actual weight. And there are duty and import costs, which vary by destination and by how the shipment is declared.
| Component | Typical range per unit | Note |
|---|---|---|
| Ex-works unit price | 16.00 to 24.00 | Varies with fabric, hardware and complexity |
| Inland and export handling | 0.60 to 1.40 | Consolidated, so low at volume |
| Ocean freight, volumetric basis | 2.20 to 5.00 | Bags charge on volume, not weight |
| Duty and import costs | 0.00 to 4.50 | Destination and classification dependent |
| Landed total | 19.00 to 34.00 | Before platform fees and backer shipping |
The volumetric freight line is the one that surprises people most. A backpack that weighs 900 grams may be charged as if it weighed 4 kg, because carriers bill on the greater of actual and volumetric weight and a packed bag is mostly air. That single line can add 15 to 30 percent to the landed cost of a bag reward, and it is why the packing specification matters as much as the product specification.
The second-order point is that landed cost moves with order quantity, and the MOQ 500 pcs per style and per colourway floor is where the curve is steepest. Moving from 500 to 1,000 units typically improves unit cost by 6 to 12 percent. Moving from 2,000 to 4,000 improves it by 3 to 6 percent. That asymmetry is why we push creators to consolidate colourways rather than add them: the volume you concentrate is worth more per unit than the variety you gain.
Production Timeline: Did It Get Shorter?
The short answer is that the production timeline did not get shorter, but the variance around it did. The 35 to 50 days bulk block has been stable across our three cohorts, and the 6 to 10 working days sampling window for standard builds has been stable too. What changed is the spread: campaigns that planned properly now land closer to the bottom of the range, while campaigns that did not still land at the top. The gap between a well-run programme and a poorly run one has widened rather than narrowed.
- Bulk production: stable at 35 to 50 days across all three cohorts.
- Sampling, standard builds: stable at 6 to 10 working days.
- Sampling, complex builds: stable at 12 to 15 working days.
- What improved: predictability, driven by earlier material commitment and cleaner approvals.
- What did not improve: the hard floor set by material procurement, which is 7 to 15 days before cutting starts.
The mechanism behind the improvement is unglamorous. Campaigns that commit material orders at sample approval rather than at bulk start remove 7 to 15 days from the critical path, because the longest single input in bag production is made-to-order fabric and trim. Campaigns that approve samples against a written specification rather than a photograph remove the most common source of a second round. Neither is a technology or a relationship advantage. Both are scheduling discipline.
The corollary is that no credible production partner can compress the schedule below the material floor, and any quote that promises to is either holding stock it will substitute later or has not costed the material. When a creator asks us to beat the 35 to 50 day block, the honest answer is that the only lever with real effect is deciding earlier. Our lead time analysis breaks down where the days actually sit.
Sampling Behaviour and Time to Approval
Sampling behaviour is where the cohorts differ most, and the movement is in the right direction. In 2024 the typical programme ran three to four rounds before approval. By 2026 that had come down to two to three, with a growing share of campaigns reaching approval in two. Since each round costs 6 to 10 working days for standard builds and 12 to 15 for complex ones, that reduction is worth roughly two to three weeks on the critical path.
The improvement came from two specific practices, both of which are available to any creator. The first is writing a specification before the first sample rather than after seeing it: target dimensions, fabric weight, hardware finish, stitch density and logo placement recorded in one document. The second is consolidating feedback, so that one round carries every correction rather than three rounds carrying one each. Neither practice costs money. Both require a decision made before the sample is built rather than after it arrives.
| Cohort | Typical rounds | Complex builds | Approval time |
|---|---|---|---|
| 2024 | 3 to 4 | 4 to 5 | 24 to 40 working days |
| 2025 | 3 to 4 | 4 to 5 | 20 to 36 working days |
| 2026 | 2 to 3 | 3 to 4 | 18 to 32 working days |
The floor is worth noting. Two rounds for a standard build and three for a complex one is close to the practical minimum, because the first round always reveals something the drawing did not. Campaigns that reach approval in a single round are almost always re-running a style that was sampled before launch, which is another argument for pre-launch sampling. The realistic planning assumption is two rounds and 12 to 20 working days, not one round and 6 days.
There is also a cost dimension. Sampling is charged per round, and the fee is normally credited against the bulk order or refunded on approval, but the calendar cost is not recoverable. Our sampling cost notes and sampling communication guide cover both sides of that.
Quality and Return Rates by Cohort
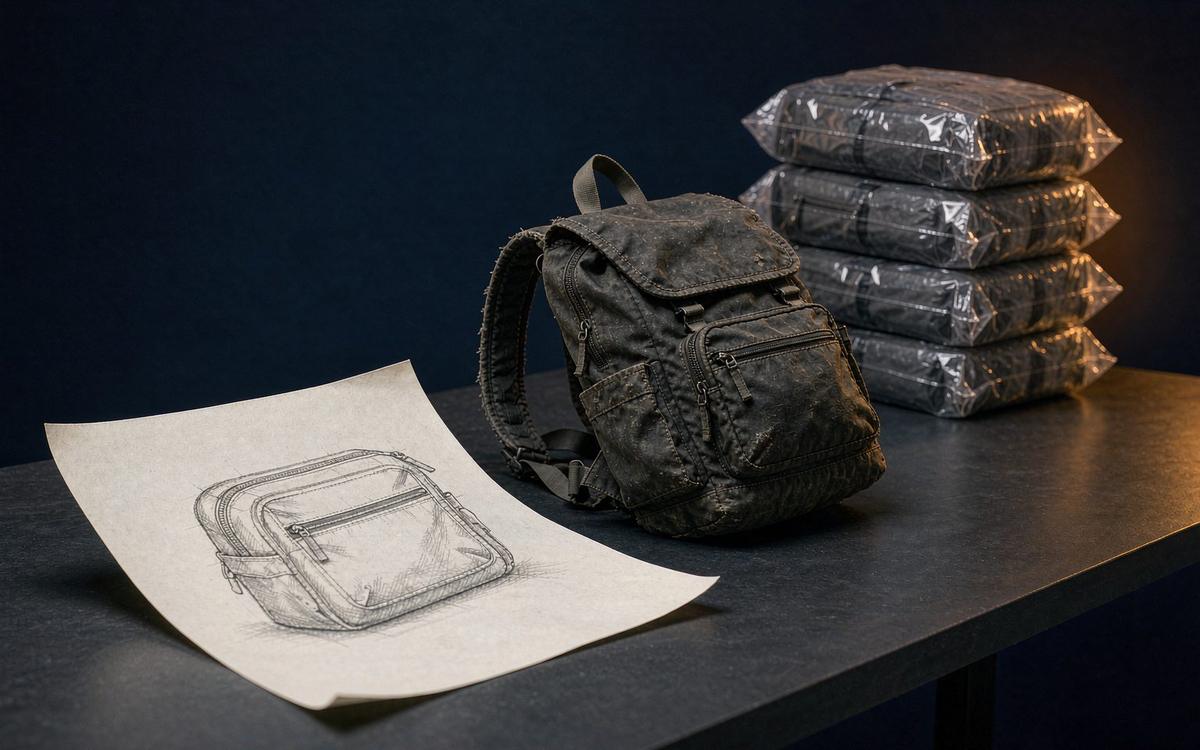
Quality outcomes are measured two ways in our cohorts, and they tell different stories. The first is the inspection pass rate at AQL 2.5 to ISO 2859-1, which has stayed broadly stable in the 94 to 98 percent band across all three years. The second is the backer-reported defect rate after delivery, which has improved more noticeably, because the defects that reach backers are disproportionately the ones inspection is poor at catching: shade mismatch between components and print registration drift.
The gap between those two measures is the useful insight. A 96 percent inspection pass rate sounds like four defects in a hundred, but the four that pass are not randomly distributed. They cluster in the categories where inspection is weakest, which is why the backer-reported rate historically ran higher than the pass rate implied. Closing that gap has been less about inspecting harder and more about inspecting the right things, specifically component-to-component shade and print placement under consistent lighting.
- Inspection pass rate: 94 to 98 percent, stable across 2024 to 2026.
- Backer-reported defects: improved, driven by shade and registration checks.
- Return rate: typically 1 to 3 percent of units for bag rewards.
- Most common defect: component shade mismatch, followed by print placement.
- Most expensive defect: the one found after bulk, not during it.
The return figures are worth stating carefully, because they are the metric creators most often misread. A 1 to 3 percent return rate on 2,000 units is 20 to 60 parcels, which is a manageable administrative load if you budget for it and a crisis if you do not. The returns are also not evenly distributed by region: corridors with longer customs dwell and less reliable last-mile service see higher rates, for reasons that have nothing to do with the bag itself.
Key takeaways
- A
- s
- t
- a
- b
- l
- e
- i
- n
- s
- p
- e
- c
- t
- i
- o
- n
- p
- a
- s
- s
- r
- a
- t
- e
- h
- i
- d
- e
- s
- a
- d
- e
- f
- e
- c
- t
- d
- i
- s
- t
- r
- i
- b
- u
- t
- i
- o
- n
- .
- T
- h
- e
- d
- e
- f
- e
- c
- t
- s
- t
- h
- a
- t
- r
- e
- a
- c
- h
- b
- a
- c
- k
- e
- r
- s
- c
- l
- u
- s
- t
- e
- r
- w
- h
- e
- r
- e
- i
- n
- s
- p
- e
- c
- t
- i
- o
- n
- i
- s
- w
- e
- a
- k
- e
- s
- t
- .
Fulfilment and Shipping Cost Movement
Shipping cost is the line item that moved most and recovered least. Freight rates shifted substantially across our three cohorts, and while they have come off their peak, the landed freight line for a volumetric bag parcel remains materially above where it sat in early 2024. The reason is structural rather than cyclical: bags are bulky, carriers charge on volume, and the volume of a packed bag does not shrink when rates fall.
For a mid-size backpack, the freight and handling component of landed cost typically runs 3 to 8 per unit on ocean consolidation, and 9 to 18 per unit if any part of the shipment moves by air. The air figure is not a rounding error; it is frequently larger than the entire labour content of the bag. Any plan that relies on air freight to recover a schedule has, in effect, chosen to spend its margin to buy back time it lost to indecision earlier in the programme.
- Consolidate to a single origin point so the freight is rated once rather than per carton.
- Specify the packing method in the brief, because compression packing changes the volumetric figure.
- Ship the slowest corridors first to compress the spread without upgrading service level.
- Reserve air for genuine exceptions, not for recovering a schedule that was never achievable.
The compression packing point deserves emphasis because it is the cheapest volumetric lever available. A bag packed flat with air expelled and a specified carton size can rate materially lower than the same bag loosely packed, and the difference is measured per unit across the entire order. It is a line in the production brief, not a change to the product, and it is the highest-return sentence a creator can add to a packing specification.
Our shipping weight guide covers how to model this before you cost a campaign, and the warehouse comparison sets out the trade-off between consolidating at origin and splitting into regional hubs.
What Separated the Top Quartile
When we split our cohorts by outcome, four behaviours separate the top quartile from the rest, and none of them is product design. The campaigns that outperform are not necessarily the ones with the most innovative bag. They are the ones that made production decisions earlier, committed material faster, and told backers something true and specific at regular intervals. The bag matters, but it is not the variable that decides which quartile you land in.
| Behaviour | Top quartile | Remaining cohorts |
|---|---|---|
| Sampled before launch | Most campaigns | Rare |
| Material ordered at approval | Standard practice | Ordered at bulk start |
| Update cadence after funding | Every 2 to 3 weeks | Monthly or ad hoc |
| Colourways offered | 2 to 3 | 4 to 6 |
| Published delivery date | A month | A specific day |
The pattern is consistent enough to be actionable on its own. A creator who samples before launch, commits material at sample approval, posts an update every two to three weeks, caps colourways at three and promises a month rather than a day has adopted the operating pattern of the top quartile regardless of what the bag looks like. None of those five decisions costs money. All of them require deciding earlier than is comfortable.
The uncomfortable part is that deciding early means spending before the campaign funds. Pre-launch sampling and early material commitment both consume cash that a creator would rather hold until funding is confirmed. The counter-argument is arithmetic: sampling before launch removes 6 to 15 working days from the critical path, and material commitment at approval removes 7 to 15 more. Together that is three to six weeks of a delivery promise, which is worth more than the working capital it costs.
How to Use These Benchmarks for Your Own Targets
The way to use these benchmarks is as a filter on your own plan, applied in a specific order. Start with the goal range for your bag type and check whether your target is inside it. Then test your reward ladder against the current structure of three to five tiers and no more than three colourways. Then run your delivery date backwards through sampling, the 35 to 50 day bulk block, consolidation and weighted regional transit. Anything that fails all three tests needs a decision, not a hope.
- Test the goal against the typical funded range for your bag category.
- Test the ladder for tier count, colourway count and whether each tier is separately costed.
- Test the date by working backwards rather than forwards from funding close.
- Test the margin with landed cost, platform fees and backer shipping all applied.
- Fix the failures now, while changing the plan costs nothing but a conversation.
If a plan fails a test, the fix is almost always to reduce scope rather than to compress time. Fewer colourways, fewer tiers, a simpler fabric, one less accessory. Each of these removes days from the critical path and dollars from the landed cost, and each is far cheaper than the alternative, which is discovering the problem after 2,000 people have pledged. The benchmarks exist to make that discovery happen during planning rather than during fulfilment.
Send us your goal, ladder and target date and our production team will run all four tests against the current benchmarks.
Frequently Asked Questions
Where does this benchmark data come from?
It is drawn from bag campaign production programmes we have run or formally costed between 2024 and 2026. That population is weighted towards projects that reached the quoting stage, so it excludes many launches that stalled earlier. Sample sizes per year are in the tens of campaigns, which is why we publish ranges rather than single averages throughout. Where a figure appears as a single number rather than a range, it reflects a hard process floor such as a minimum order quantity rather than an observed average.
How much did typical bag campaign goals change from 2024 to 2026?
Typical funded goal ranges moved from roughly 25,000 to 60,000 in 2024 to about 35,000 to 90,000 in 2026. Most of that movement came from product mix rather than from backers paying more for the same thing: campaigns carrying structured backpacks and travel pieces replaced some of the simpler totes and pouches. A smaller part of the movement came from genuine input cost increases, and almost none of it came from backers simply being willing to pay more for an identical product.
Did production timelines get shorter between 2024 and 2026?
No. The bulk production block has held at 35 to 50 days across all three cohorts, and standard sampling has held at 6 to 10 working days, with complex builds at 12 to 15. What improved is predictability: campaigns that plan properly now land nearer the bottom of the range rather than the top. The practical consequence is that any end-to-end promise shorter than 45 days is a bet on someone else holding stock rather than on your own production schedule.
How many sampling rounds should I budget for?
Two rounds for a standard build and three for a complex one. That is close to the practical floor, because the first round always reveals something the drawing did not capture. Single-round approval is usually only achieved when the style was already sampled before the campaign launched. Budget the calendar on that basis rather than on the best case, because the best case is rare and the cost of being wrong is a missed public date.
What is a typical inspection pass rate for bag rewards?
In our cohorts the pass rate at AQL 2.5 to ISO 2859-1 sits in a 94 to 98 percent band and has been stable across 2024, 2025 and 2026. The more useful measure is the backer-reported defect rate, because the defects that pass inspection cluster in shade mismatch and print registration. If your inspection pass rate and your backer complaint rate disagree, the explanation is almost always in one of those two categories.
Why did landed unit costs rise across the cohorts?
Material and labour inputs moved up through 2024 and into 2025 before flattening into a narrower band by 2026. A budget built on 2024 unit costs will typically under-run by 15 to 25 percent if it is not refreshed, and that gap is the most common reason a funded campaign cannot afford its own reward. Freight moved separately and, for bulky bag parcels, is rated on volume rather than actual weight, which amplifies the effect considerably on a per unit basis.
What return rate should I plan for on a bag reward?
Typically 1 to 3 percent of units. On 2,000 bags that is 20 to 60 parcels needing action through address problems, transit damage or carrier error. The rate is not evenly distributed by region: corridors with longer customs dwell and less reliable last-mile service run higher. Set the reshipment budget before despatch begins, so that offering a replacement is an administrative decision rather than a financial one.
How often should I post updates after funding closes?
Every two to three weeks in our top quartile cohorts, versus monthly or ad hoc in the rest. Cadence matters more than length. A short update that names the current production stage and confirms the date outperforms a long update that appears after six weeks of silence. Silence, rather than delay, is what converts a patient backer into a refund request, and it is entirely within the creator's control.
Should I promise a specific delivery day on my campaign page?
No, publish a month. Backers measure against the promise rather than against the calendar, so a specific date converts normal regional variance into perceived failure. Once freight is moving, share per-region windows in updates, where you can be more precise without creating a new promise. Per-region windows in campaign updates are different, because they are estimates that firm up as cartons actually clear customs.
How many reward tiers should a bag campaign offer?
Three to five. The cohorts moved down from four to seven in 2024, and the tiers that disappeared were in the middle rather than at either end. Keep one entry tier and one premium tier, then move the remaining choices into add-ons. Add-ons give backers the same range of choice without multiplying the page, the bill of materials or the packing plan.
What is the most reliable way to shorten a bag delivery schedule?
Decide earlier. Sampling before launch removes 6 to 15 working days, and committing material at sample approval rather than at bulk start removes another 7 to 15. No production partner can compress below the material procurement floor, whatever the quote says. The two levers with real effect are sampling before launch and committing material at sample approval, and both are scheduling decisions rather than relationship ones.
Can I use these benchmarks to forecast my own funding?
Use them to sanity-check, not to forecast. Goal size is a function of your audience, not your product, so a range taken from another campaign tells you little about your outcome. The structural rows transfer better: tier counts, colourway caps, sampling rounds and schedule blocks. Those are decisions you control, unlike the audience you happen to arrive with, so test your plan against structure before you test it against hope.
People Also Ask
What is a typical bag campaign goal?
Funded bag campaigns in our cohorts typically landed between 35,000 and 90,000 by 2026, up from roughly 25,000 to 60,000 in 2024. Goal size tracks audience size more than product.
How long does bag production take?
Bulk production runs 35 to 50 days after sample approval, with sampling at 6 to 10 working days for standard builds and 12 to 15 for complex ones.
How many sampling rounds are normal?
Two to three rounds is normal by 2026, down from three to four in 2024. Single-round approval usually means the style was already sampled before launch.
What is a good inspection pass rate?
94 to 98 percent at AQL 2.5 to ISO 2859-1. Watch the backer-reported defect rate too, since the defects that pass cluster in shade and registration.
How many reward tiers should I offer?
Three to five. Ladders shortened across the cohorts, and the tiers dropped were in the middle. Move extra choice into add-ons instead.
Did bag campaign costs go up?
Landed unit cost for a mid-tier backpack moved from roughly 18 to 26 in 2024 to 22 to 32 by 2026. Refresh any budget older than 12 months.
How often should I update backers?
Every two to three weeks after funding. Cadence beats length, and each update should name the current production stage and reconfirm the date.